Should investors buy yield enhancement products (YEP), which typically offer higher-than-market yields from a package comprised of an underlying stock or equity index and a series of short put options? In the August 2020 version of her paper entitled “Engineering Lemons”, Petra Vokata examines gross and net performances of YEPs, which embed fees as a front-end discount (load) allocated partly to issuers and partly to distributing brokers as a commission. Using descriptions of underlying assets and cash flows before and at maturity for 28,383 YEPs linked to U.S. equity indexes or stocks and issued between January 2006 and September 2015, and contemporaneous Cboe S&P 500 PutWrite Index (PUT) returns as a benchmark, she finds that:
- Over the full sample, YEPs offer attractive yields but negative returns (see the chart below).
- On average, YEPs effectively charge 6-7% in annual fees and subsequently lose 6-7% relative to risk-adjusted benchmarks.
- Relative to PUT, YEPs generate -7.9% annualized alpha.
- Simple and combinations of liquid options often beat YEPs.
- Learning, disclosure and competition have not fully disciplined the market for YEPs.
- After especially bad performance during the 2008 financial crisis, YEP issuance declines by about 40% in 2009, but quickly recovers in 2010 to over 90% of the 2008 level.
- A new SEC fair product value disclosure rule in 2013 has no significant effect on subsequent YEP fees.
- During 2010-2015, YEP fees decline significantly as competition increases. However, even in 2015, expected YEP return is still negative.
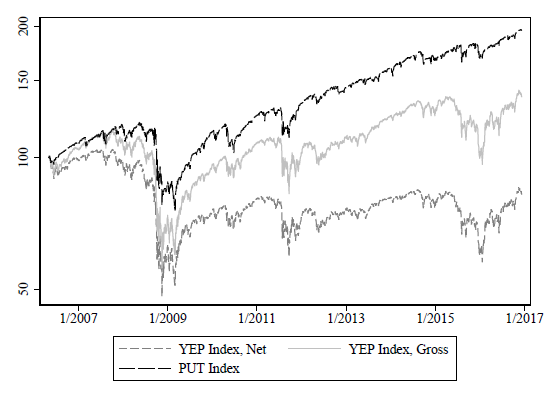
The following chart, taken from the paper, compares cumulative performances of:
- YEP Index, Net – volume-weighted portfolio of YEPs based on daily component rebalancing, coupon reinvestment and estimated fair value through maturity for 27, 578 YEPs, including embedded fees.
- YEP Index, Gross – version of the YEP portfolio that excludes embedded fees by skipping the large negative issue-day return (load).
- PUT as a benchmark that is reasonably similar to YEPs, each month selling a 1-month, at-the-money, S&P 500 Index put option and holding proceeds at the U.S. Treasury bill (T-bill) yield.
Annualized excess returns (relative to T-bill yield) for YEP Index, Net, YEP Index, Gross and PUT during May 2006 through December 2016 are 6.4%, -0.9% and 3.9%, respectively. All three indexes incur large negative returns during market crises. The YEPs link mostly to individual stocks and are therefore less diversified than PUT, as reflected in high YEP index volatility.

In summary, evidence indicates that investors should be very skeptical about overall performance of structured financial products offering higher-than-market yields.
Cautions regarding findings include:
- Data are stale. Increasing competition during 2016-2020 may have further reduced YEP embedded fees.
- PUT is an index, not a tradable asset. Funds that track PUT generally underperform it due to implementation frictions and fees. See also “Performance of CBOE PutWrite Indexes”, “Simple Stock Index Option Strategies” and “Are Equity Put-Write ETFs Working?”.