Many asset class allocation, asset valuation/selection and asset return anomaly studies ignore or treat lightly the implications of liquidity constraints. What are those implications and how serious are they? In his December 2010 paper entitled “Comatose Markets: What If Liquidity is Not the Norm?”, Aswath Damodaran examines how introducing illiquidity into decision processes affects investors with different time horizons and investment strategies. He focuses on trading friction (brokerage fees, bid-ask spread and price impact) as an illiquidity measurement. Using results from prior research and recent data on liquidity variations within and across asset classes, he finds that:
- Liquidity varies widely across asset classes, with financial assets generally more liquid than real assets. Within each asset class, there are variations in liquidity across individual assets.
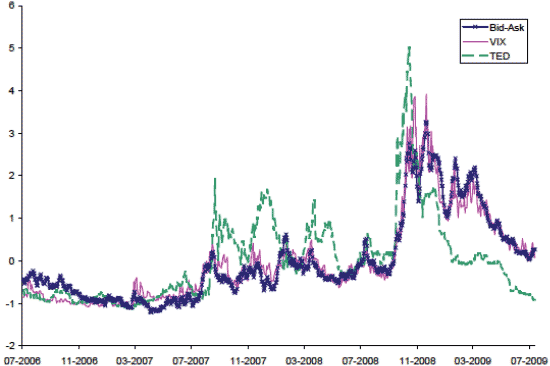
- Liquidity also varies over time. Over the last century, there is a secular trend towards more liquidity (see “Trading Frictions Over the Long Run”). Within this secular trend, there are cyclical liquidity ebbs and flows. Spikes in illiquidity generally coincide with market crises (see the chart below).
- Regulatory actions and tax policy can have significant effects on market liquidity (ending of fixed commissions, decimalization of the quote system, capital gain tax level and holding period).
- Conventional valuation models, which ignore liquidity, tend to thereby overvalue illiquid assets. Moreover, since some investors care more about illiquidity than others, ignoring liquidity obscures the reality different investors value the same asset differently, especially during periods of market illiquidity. Ways of incorporating illiquidity into valuations are: (1) reducing the value of an asset by the present value of expected future transactions costs; and, (2) raising the required rate of return (discount rate) on an asset to reflect its illiquidity.
- Portfolio optimization methods generally ignore differences in liquidity across asset classes. As market trading volume and liquidity decrease, the standard deviation of returns usually drops, making illiquid assets look less risky. Conventional asset allocation methods thus tend to overweight illiquid asset classes. Asset class allocation should have three dimensions of expectation: return, standard deviation of returns and illiquidity. Investors who value liquidity more (less) should tilt toward more (less) liquid asset classes, with the tilt accentuated during periods when the market is especially illiquid.
- Most studies of return-enhancing characteristics for individual securities pay only lip service to trading friction, but the congruence between stocks that look cheap in these studies and illiquidity is too high to be coincidental. Failure to incorporate liquidity differences results in overweighting of illiquid securities (such as small-capitalization stocks). Three ways to account for liquidity differences in security selection are: (1) estimate trading frequency and friction and compute net expected returns; (2) add liquidity (volume or share turnover) to security selection screens; and, (3) explicitly add a liquidity (trading friction) constraint at the portfolio level.
- Liquidity should be an explicit consideration in setting investment strategy leverage, with leverage decreasing as illiquidity increases.
- Long-term value investors, who care little about liquidity because they trade very infrequently, can extract profits from liquidity-sensitive investors during market crises, as did Warren Buffett in 2008 with investments in Goldman Sachs and General Electric. Short-term traders who can anticipate shifts in liquidity may be able to extract profits from those who cannot.
The following chart, taken from the paper, shows the evolutions of the bid-ask spread for large-capitalization U.S. stocks, the implied volatility of the S&P 500 Index (VIX) and the TED spread during July 2006 to July 2009. For comparability, each series is scaled to have zero mean and unit standard deviation. The bid-ask spread surges during the September-December 2008 financial crisis, tracking closely the behavior of VIX. The price impact of trading also surges during the crisis. The bid-ask spread remains elevated for months after the crisis. Investors whose strategies forced trading during this period incurred considerable trading friction likely unanticipated by those strategies.

In summary, evidence of variations in liquidity across asset classes, within asset classes and over time indicates that investors should incorporate liquidity as a decision factor in asset class allocation, security selection and trade timing. Instances of illiquidity may be bargains for long-term investors. Anticipation of liquidity changes may enable superior returns for traders.