How should investors feel about factor/multi-factor investing? In their February 2019 paper entitled “Alice’s Adventures in Factorland: Three Blunders That Plague Factor Investing”, Robert Arnott, Campbell Harvey, Vitali Kalesnik and Juhani Linnainmaa explore three critical failures of U.S. equity factor investing:
- Returns are far short of expectations due to overfitting and/or trade crowding.
- Drawdowns far exceed expectations.
- Diversification of factors occasionally disappears when correlations soar.
They focus on 15 factors most closely followed by investors: the market factor; a set of six factors from widely used academic multi-factor models (size, value, operating profitability, investment, momentum and low beta); and, a set of eight other popular factors (idiosyncratic volatility, short-term reversal, illiquidity, accruals, cash flow-to-price, earnings-to-price, long-term reversal and net share issuance). For some analyses they employ a broader set of 46 factors. They consider both long-term (July 1963-June 2018) and short-term (July 2003-June 2018) factor performances. Using returns for the specified factors during July 1963 through June 2018, they conclude that:
- Coding errors, data snooping, trade crowding and assumption of unrealistic (often zero) implementation frictions inflate expectations for factor portfolio performance.
- Top academic journals report discovery of over 400 factors through 2018, with the sheer number suggesting that many are spurious due to intense snooping of finite data by a large number of researchers.
- Average gross return for 46 factors during the 10 years after the discovery sample is less than half that during the 10 years before.
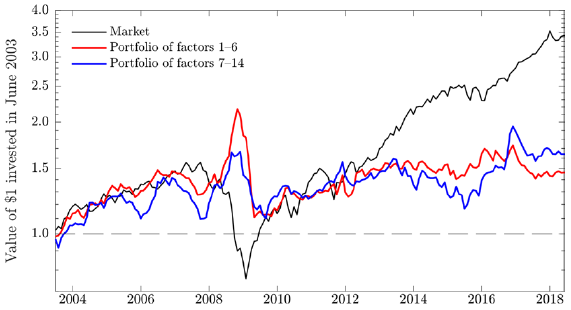
- Gross performance of the most popular factors since mid-2003, out-of-sample for most, is weak (see the chart below):
- None deliver a statistically significant excess gross return.
- Four of six model factors have close to zero or negative excess gross returns (average 2.35% per year).
- The eight other popular factors have annual average excess gross return 1.97%.
- Market betas of factors vary widely over time. Equal-weighted portfolios of the six model factors and of the other eight popular factors have mostly negative correlations with the market, less than -1.0 at the end of the 1990s. However, their betas surge close to 1.0 during the 2008–2009 market crash, recently increasing toward zero.
- Factor returns experience downside shocks far larger than indicated by a normal distribution of returns. For the six model factors and the other eight popular factors:
- Assuming a normal distribution, 11 of 14 actual worst months during July 1963-June 2018 should occur less than once in 2,000 years.
- Momentum and illiquidity have pronounced negative skewness and the sharpest crashes, with the former suffering -44% drawdown during 2009.
- All factor return distributions have positive kurtosis (fat tails) and associated relatively high crash risk.
- Diversification across factors vanishes in periods of market stress. In other words, large drawdowns of individual factors happen at the same time.
- The worst month for an equally weighted portfolio of the six model factors is -16%, about the same as the average worst month for individual factors.
- Maximum drawdowns for equally weighted portfolios of the six model factors and the eight other popular factors are -33% and -43%, respectively.
The following chart, taken from the paper, compares gross cumulative performances of $1 initial investments in each of:
- Market – market excess return (relative to 30-day U.S. Treasury bills).
- Portfolio of factors 1-6 – equally weighted portfolio of the six model factors, leveraged to match market volatility over the full July 1963-June 2018 sample period.
- Portfolio of factors 7-14 – equally weighted portfolio of eight other popular factors, with comparable leverage.
Results show that the portfolios of factors generally underperform the market during July 2003 through June 2018, with only a brief burst of outperformance during the 2008-2009 market crash.

In summary, investors should be skeptical regarding claims that either the current set of equity factors or any new factors offer truly attractive performance.
Cautions regarding conclusions include:
- While citing other studies that attempt to account for realistic factor portfolio implementation costs, the analyses in the paper do not account for portfolio reformation frictions and shorting costs/constraints. In other words, even the pessimistic results overstate factor performance.
- As noted by the authors, there is still a possibility that recent factor performance is bad luck and not bad research.
- Results are limited to the U.S. equity market and equity factors.
For a limited but very practical check on conclusions, see “Are Equity Multifactor ETFs Working?”.