Can portfolios exhibit properties not evident from, or even contrary to, average properties of their component assets? In the April 2011 draft of their paper entitled “The Sources of Portfolio Returns: Underlying Stock Returns and the Excess Growth Rate”, Jason Greene and David Rakowski provide a framework for distinguishing two sources of portfolio return: (1) weighted average growth rates of component assets; and, (2) portfolio “excess growth rate” derived from diversification (component return volatilities and correlations). They apply this framework to investigate equity portfolio equal-weighting versus value-weighting, and to isolate the sources of the size effect and the value premium. They establish consistency in return measurements by matching rebalancing frequency and return measurement interval. Using monthly returns and firm characteristics for a broad sample of U.S. stocks over the period 1960 through 2009, they find that:
- Portfolios of stocks with relatively high-volatility returns (but not extremely high return correlations) tend to outperform portfolios of low-volatility stocks over time. Specifically:
- Equal-weighted portfolios tend to outperform value-weighted portfolios despite the long-term individual underperformance of small-capitalization stocks. Over the entire sample of stocks and the entire sample period, an equal-weighted (value-weighted) portfolio generates an annualized gross compound return of 11.7% (9.0%).
- The equal-weighted (value-weighted) average annual stock compound growth rate is 0.3% (4.9%). In other words, the value-weighted portfolio has more exposure to stocks with high compound growth rates, suggesting that small-capitalization stocks individually tend to underperform.
- However, the average annual gross portfolio excess growth rate for equal (value) weighting is 11.1% (4.1%). Diversification thus accounts for more than 95% of equal-weighted portfolio growth, overpowering individual stock performance.
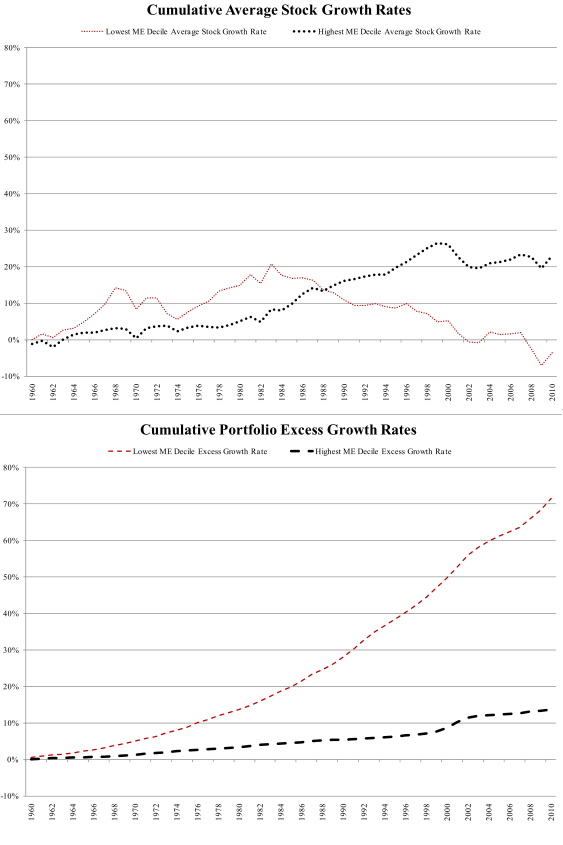
- Portfolio excess growth rate increases systematically from largest to smallest size decile. While small-capitalization stocks tend to have lower compound growth rates than large-capitalization stocks, portfolios of small-capitalization stocks tend to outperform portfolios of large-capitalization stocks. In other words, a very large diversification return contribution overpowers a contrary individual stock return contribution to drive the size effect (see the charts below).
- Equal-weighted portfolios tend to outperform value-weighted portfolios despite the long-term individual underperformance of small-capitalization stocks. Over the entire sample of stocks and the entire sample period, an equal-weighted (value-weighted) portfolio generates an annualized gross compound return of 11.7% (9.0%).
- Over the entire sample of stocks and the entire sample period, individual stocks with high book-to-market ratios tend to have higher compound growth rates than individual stocks with low book-to-market ratios, driving portfolios of high book-to-market stocks to outperform. In other words, the value premium derives from individual stock outperformance. Specifically:
- Average stock compound growth rates increase almost systematically from lowest (-1.16% per month) to highest (0.55% per month) book-to-market decile.
- However, average gross portfolio excess growth rate decreases almost systematically from lowest (1.52% per year) to highest (0.91% per year) book-to-market decile. In this case, the individual stock return contribution overpowers a relatively small contrary diversification return contribution to drive the value premium.
The following two charts, taken from the paper, depict cumulative average individual stock compound growth rate (upper chart) and the cumulative gross portfolio excess growth rate (lower chart) from January 1960 through December 2009 for the lowest and highest deciles of stocks sorted annually by market capitalization (ME). Results show that the typical small-capitalization stock substantially underperforms the typical large-capitalization stock over the entire sample period. However, the diversification benefit for the portfolio of small-capitalization stocks is consistently much greater than the diversification benefit for the portfolio of large-capitalization stocks.
The diversification benefit among small-capitalization stocks overpowers their typical underperformance relative to large-capitalization stocks, such that the small-capitalization portfolio beats the large-capitalization portfolio based on combined results. In fact, by the end of the sample period, all small-stock portfolio returns come from the diversification return contribution.

In summary, evidence suggests that investors may be able to enhance long-term portfolio performance by examining and improving contributions from: (1) compound growth rates of components; and, (2) diversification benefit of component return volatilities/correlations. Specifically, investors should view the size effect as predominantly portfolio-level and the value premium as predominantly stock-level.
More generally, evidence indicates that investors should not assume that the return properties of portfolios and their individual components are identical.
Cautions regarding findings include:
- Reported portfolio-level returns are gross, not net. Incorporating costs of monthly rebalancing would reduce portfolio excess growth rates, probably more emphatically for groups of small stocks than groups of large stocks.
- The study assumes tame return distributions readily interpreted by mean and standard deviation. To the extent actual return distributions are wild, these interpretations become unreliable.
See “Emergent Size-Value Patterns of Noise?” for other research with some similarities.