Is more clearly better in terms of number of factors included in a stock screening strategy? In the October 2014 draft of their paper entitled “Incremental Variables and the Investment Opportunity Set”, Eugene Fama and Kenneth French investigate the effects of adding to an established multi-factor model of stock returns an additional factor that by itself has power to predict stock returns. They focus on size, book-to-market ratio (B/M, measured with lagged book value), and momentum (cumulative return from 12 months ago to one month ago, with a skip-month to avoid systematic reversal). They consider a broad sample of U.S. stocks and three subsamples: microcaps (below the 20th percentile of NYSE market capitalizations); small stocks (20th to 50th percentiles); and, big stocks (above the 50th percentile). They perform factor-return regressions, and they translate regression results into portfolio returns by: (1) ranking stocks into fifths (quintiles) based on full-sample average regression-predicted returns; and, (2) measuring gross average returns from hedge portfolios that are long (short) the equally weighted quintile with the highest (lowest) expected returns. Finally, they perform statistical tests to determine whether whether the maximum Sharpe ratio for quintile portfolios constructed from three-factor regressions is realistically higher than those for two-factor regressions. Using monthly excess returns (relative to the one-month Treasury bill yield) for a broad sample of U.S. stocks during January 1927 through December 2013, they find that:
- Single-factor and multi-factor regressions of monthly returns over the sample period confirm that:
- Small stocks and value (high-B/M) stocks tend to have higher average returns than big and growth stocks.
- The size effect is stronger for microcaps than for small and big stocks.
- Much of the value effect comes from smaller stocks, especially microcaps.
- High-momentum stocks tend to have higher average returns than low-momentum stocks.
- Combining the three factors in a multivariate regression strengthens predictability (especially combining B/M and momentum, returns of which relate negatively).
- Small stocks and value (high-B/M) stocks tend to have higher average returns than big and growth stocks.
- Performances of single-factor and multi-factor hedge portfolios over the sample period indicate that:
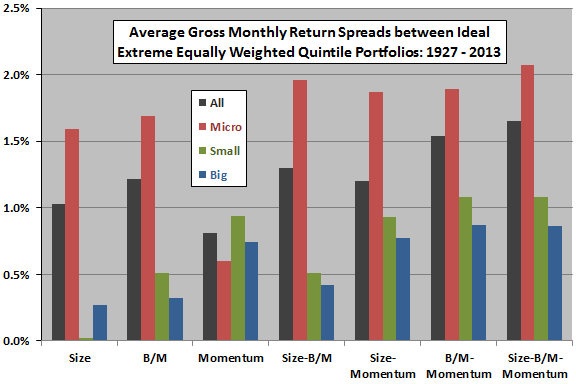
- All generate significant gross returns of at least 0.81% per month (9.7% per year).
- Microcaps typically produce the largest spreads. But, even for big stocks, gross average returns are at least 0.27% per month (3.2% per year).
- Most microcap gross average returns decline across two subperiods, but those for small and big stocks are similar.
- The effect of adding a third factor to a two-factor portfolio is generally modest compared to the third factor’s standalone performance (see the chart below), because:
- Returns for the third factor generally relate positively to those for the prior portfolio (some of the third factor’s predictive power is already in the prior portfolio).
- Conversely, adding the third factor generally weakens the powers of the prior factors to pick stocks for extreme quintiles (adding a factor sacrifices some of the predictive power in the prior portfolio).
- Said differently, adding a factor can increase hedge portfolio performance only by replacing stocks in extreme quintiles, and the resulting turnover reduces the performance of the original factor(s). This logic implies that the greater the predictive power of an added variable, the more it disrupts the stock selections of the original factor(s).
- Adding a third factor produces a large increase in the maximum theoretical Sharpe ratio. However, portfolios that produce this maximum Sharpe ratio typically involve unrealistic leverage (such as short positions more than 100 times portfolio value). For long-only investors, the boost in Sharpe ratio from adding a third factor is typically small, often trivial.
The following chart, constructed from data in the paper, shows gross average monthly returns for hedge portfolios that are long (short) the equally weighted quintile of stocks with the highest (lowest) expected returns based on average full-sample regression predictions during 1927 through 2013. Results indicate that:
- Size and value (but not momentum) effects are most evident among microcap stocks.
- Momentum is key for small and big stocks.
- Adding the size factor to a strategy already including the B/M and momentum factors offers very little gross improvement.
- Adding the B/M factor to a strategy already including the size and momentum factors offers a little gross improvement.
Note that full-sample predictions incorporate look-ahead bias, so the results are ideal. An investor operating in real time could rank stocks based only on historical data.

In summary, evidence indicates that adding a factor to a multi-factor model for picking stocks generally offers only modest gross improvement for realistic portfolio implementations.
Cautions regarding findings include:
- As noted by the authors, the quintile formation process uses full-sample data and is therefore not an executable investment strategy. They report that an approach based on a rolling window of 36 months of historical data reduces hedge portfolio returns.
- Reported hedge portfolio returns are gross, not net. Accounting for the trading frictions of monthly portfolio reformation and the costs of maintaining the short sides of portfolios would reduce these returns. Moreover, different factors may drive different turnovers and shorting costs, such that net relative factor effectiveness differs from gross relative effectiveness.