As described in “Quantifying Snooping Bias in Published Anomalies”, anomalies published in leading journals offer substantial opportunities for exploitation on a gross basis. What profits are left after accounting for portfolio maintenance costs? In their November 2017 paper entitled “Accounting for the Anomaly Zoo: A Trading Cost Perspective”, Andrew Chen and Mihail Velikov examine the combined effects of post-publication return deterioration and portfolio reformation frictions on 135 cross-sectional stock return anomalies published in leading journals. Their proxy for trading frictions is modeled stock-level effective bid-ask spread based on daily returns, representing a lower bound on costs for investors using market orders. Their baseline tests employ hedge portfolios that are long (short) the equally weighted fifth, or quintile, of stocks with the highest (lowest) expected returns for each anomaly. They also consider capitalization weighting, sorts into tenths (deciles) rather than quintiles and portfolio constructions that apply cost-suppression techniques. Using data as specified in published articles for replication of 135 anomaly hedge portfolios, they find that:
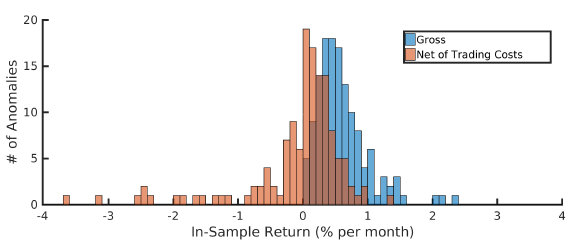
- The average anomaly hedge portfolio net return is negative in-sample. Specifically (see the first chart below):
- The typical anomaly requires 15% monthly turnover of long and short sides, often involving illiquid stocks that have effective bid-ask spreads around 2.0%.
- The typical anomaly thus earns an average -0.08% net monthly return during its published sample period.
- Only about a quarter of anomaly net returns are significantly positive.
- Anomalies with positive in-sample net returns deteriorate rapidly to negative net returns post-publication. Specifically, for the quarter of anomalies with the best in-sample net returns (see the second chart below):
- Performance decay appears to anticipate publication by about three years. The trailing 5-year average monthly gross return across anomalies falls from about 0.8% three years before publication to about 0.3% at the time of publication.
- The trailing 5-year average net return at the time of publication is statistically indistinguishable from zero.
- The best-performing combinations of anomalies and efficient portfolio construction techniques produces just 0.25% average monthly net return during the five years after publication. This average falls to zero within 15 years, and results are very sensitive to method of portfolio construction.
The following chart, taken from the paper, compares distributions of 135 anomaly average gross and net returns based on quintile hedge portfolios as specified above using the published sample periods. Net of portfolio reformation frictions, most anomalies have negative returns, and only a handful have statistically significant positive returns. Only one anomaly has average monthly net return over 1.0%. Moreover, the strong right skew of gross returns disappears after accounting for portfolio frictions. (See “AAII Stock Screens” for a similar, more investor-oriented, analysis.)

The next chart, also from the paper, examines average net returns from 50 years before (-50) to 20 years after (20) time of publication (0) for the quarter of anomalies with the highest in-sample net returns that have enough data to calculate the full time series. Specifically, the:
- Gray series is the average net return across top-performing anomalies.
- Blue line is the trailing 5-year moving average of average net return.
- Red lines are 2-standard error confidence bounds for the blue line.
Results show that average net return begins to deteriorate to statistical insignificance several years before publication. Eventually, average net return deteriorates to zero.

In summary, evidence suggests that applying portfolio reformation frictions (effective bid-ask spreads) to stock anomalies published in leading journals practically empties the academic factor zoo.
Cautions regarding findings include:
- Bid-ask spreads used to estimated trading frictions for portfolio reformations are modeled, not measured.
- As noted by the authors, large-scale traders may face larger effective bid-ask spreads than those modeled. In other words, the modeled effective bid-ask spread does not account for market depth.
- The authors do not consider broker fees, costs of shorting and infeasibility of shorting some stocks due to lack of shares to borrow.
See also:
- “Taming the Factor Zoo?”
- “Most Stock Anomalies Fake News?”
- “Integrated Approach to Factor Investing”
- “Effects of In-sample Bias and Market Adaptation on Stock Anomalies”
- “Testing 25 U.S. Stock Market Return Predictors”
- “Live Performance of Alternative Beta Products”
- “Why Smart Beta Funds Will Disappoint?”
- “Liquidity Eroding Anomalies?”