Does demand for high-beta stocks by money managers extinguish the risk-return relationship? In his May 2012 paper entitled “Agency-Based Asset Pricing and the Beta Anomaly”, David Blitz investigates whether a volatility preference among stock portfolio managers flattens any relationship between beta and expected returns, thereby invalidating the most widely used asset pricing models. Because institutional investors typically evaluate portfolio managers versus market returns and prohibit or limit leverage, these managers have an incentive (under a belief in reward-for-risk) to focus investments in high-beta stocks with high expected returns. He calculates beta of a stock by regressing its monthly returns (in excess of the risk-free rate) against stock market excess monthly returns over the prior 60 months. Using monthly returns and characteristics for a broad sample of U.S. common stocks during July 1926 through December 2010, along with various benchmark data, he finds that:
- While there is evidence of size, value and momentum (based on past 11 months, with skip-month) premiums over the entire sample period, there is no evidence of a beta premium. In other words, the relationship between beta and future return for stocks is flat on a monthly basis.
- Accounting for the use of the market return as an institutional benchmark in the Fama-French three-factor model (by assuming a flat relationship between beta and return) improves the model’s ability to explain the performance of portfolios sorted on beta or volatility (standard deviation of monthly returns over the past 60 months), while retaining its ability to explain size and book-to-market effects.
- Revised three-factor model effectiveness is:
- Very similar for equal-weighted and value-weighted portfolios.
- Robust across subperiods.
- At least as good at explaining industry returns as the conventional three-factor model.
- The revised three-factor model does not explain the momentum, which requires a fourth winner-minus-loser factor.
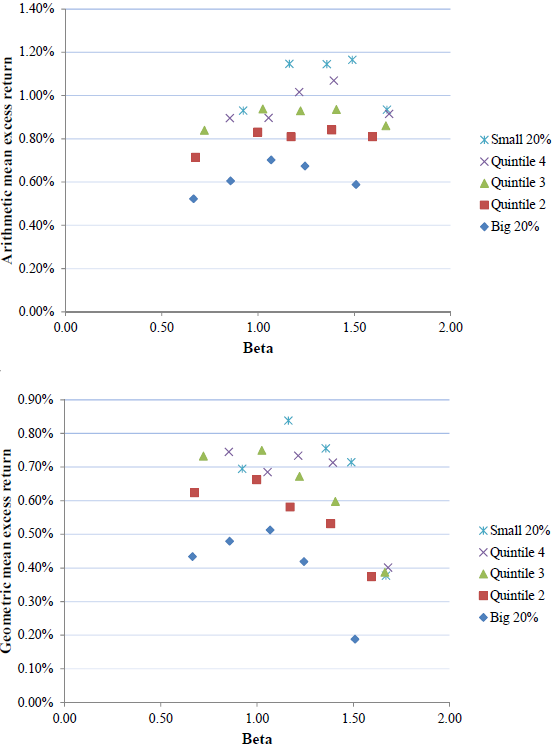
- Compounding the monthly relationship between beta and return changes the empirical relationship between return and risk (beta) from flat to negative (see the charts below).
The following charts, taken from the paper, illustrate the effects of compounding the empirically flat monthly relationship between stock beta and expected stock return. The charts summarize average returns in excess of the risk-free rate for 25 portfolios sorted independently on size and beta, and grouped by size. The upper (lower) chart presents average returns for a short-term (long-term) horizon using arithmetic (geometric) averaging. Differences between the two charts are due to compounding, with a principal difference being a shift from an overall flat to an overall negative relationship between expected return and beta.

In summary, evidence indicates that investors may be able to exploit attractive absolute risk-adjusted returns of low-beta and low-volatility stocks over long investment horizons.
Cautions regarding findings include:
- Return calculations in the study are gross, not net. Accounting for reasonable trading frictions, which vary considerably over the sample period, would lower returns and may affect findings.
- The negative relationship between long-horizon return and beta (in the lower chart) is not systematic across beta quintiles or among size groups, undermining belief in reliability of the effect.