Does crowding of factor investing strategies reliably predict returns for those strategies? In his March 2019 paper entitled “The Impact of Crowding in Alternative Risk Premia Investing”, Nick Baltas explores mechanics of alternative risk (factor) premium crowding and implications of crowding for future performance. He classifies factor premiums as: divergent (such as momentum), inherently destabilizing due to positive feedback loops and lack of fundamental anchors; or, convergent (such as value), having self-correcting negative feedback loops and fundamental anchors. To test crowding effects, he considers the following premiums: equity value (book-to-market), size (market capitalization), momentum (from regression of return from 12 months ago to one month ago versus volatility), quality (return on assets) and low beta (versus the MSCI World Index); commodities momentum (12-month return); and, currencies value (purchasing power parity) and momentum (12-month return). Each premium consists of returns from a hedge portfolio that is each week long (short) the equal-weighted assets with the highest (lowest) expected returns. For equities, he uses top and bottom tenths. For commodities and currencies, he uses top and bottom thirds. His crowding metric (CoMetric) is average pairwise correlation of factor-adjusted returns of assets within the long or short sides of premium portfolios over the last 52 weeks (except 260 weeks for value). He defines the 20% of weeks with the highest (lowest) CoMetrics as most (least) crowded. Using the specified factor and return data for liquid developed market stocks since September 2004, 24 constituents of the S&P GSCI Commodity Index since January 1999, and 26 developed and emerging markets currency pairs versus the U.S. dollar since January 2000, all through May 2018, he finds that:
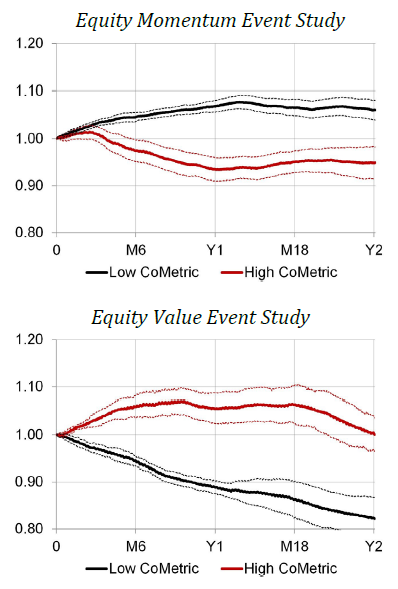
- Crowding tends to be bad for divergent premiums (see, for an example, the first chart below).
- Behaviors of divergent premiums after most and least crowded weeks is not significantly different over the first month, perhaps because these premiums are in the last stage of self-reinforcement.
- However, over ensuing months through about a year, these premiums tend to perform poorly (well) after the most (least) crowded weeks.
- In unreported results, divergent premiums exhibit elevated volatility after crowding, supportive of risk management via volatility targeting.
- Conversely, crowding tends to be good for convergent premiums (see, for an example, the second chart below).
- For about a year, convergent premiums perform well after the most crowded weeks.
- After the least crowded weeks, these premiums tend to perform poorly over the next two years.
- In unreported results, convergent premiums exhibit depressed volatility after crowding, unsupportive of risk management via volatility targeting.
- The size premium is an outlier, not significantly affected by level of crowding (though still performing better during the six months and one year after weeks with lowest crowding than after weeks with highest crowding).
The following charts, taken from the paper, track average cumulative gross performances of equity momentum (upper chart) and value (lower chart) premiums during the two years after weeks of most and least crowding (high and low CoMetrics). Sample periods are October 2005 through May 2018 for momentum and October 2009 through May 2018 for value. Results show that crowding is generally harmful for equity momentum strategies and generally helpful for equity value strategies.

In summary, evidence suggests that strategy crowding is bad for momentum-like strategies and good for value-like strategies.
Cautions regarding findings include:
- Sample periods are short in terms of variety of market conditions, 2-year event analyses and, especially, 5-year rolling windows used to calculate CoMetric for value factors.
- Returns are gross, not net. Accounting for weekly factor portfolio reformation frictions and shorting costs/constraints would reduce returns. These costs may vary by factor and by crowding conditions, such that net findings may differ from gross findings.
- Measurement of crowding extremes (top 20% and bottom 20% of CoMetric) are largely in-sample. An investor operating in real time could not know the cutoffs except during the last 1.5 years of each sample. Findings may differ for a tradable out-of-sample approach. However, the author separately reports that “we have tried expansion window as well and the results remain qualitatively similar (results are not in the paper)” [emphasis added] .
For related perspectives, see: