Will disinvestment of the baby boom generation retard U.S. equities? In their August 2011 letter entitled “Boomer Retirement: Headwinds for U.S. Equity Markets?”, flagged by a reader, Zheng Liu and Mark Spiegel revisit the relationship between U.S. age demographics and U.S. equity valuation as indicated by the lagged price-earnings ratio (P/E). They calculate P/E based on year-end level of the S&P 500 Index adjusted for inflation and inflation-adjusted S&P 500 earnings over the prior 12 months. They specify a critical demographic metric, M/O, based on the ratio of the middle-age cohort (ages 40–49) to the old-age cohort (ages 60–69), epitomizing equity investors and equity disinvestors, respectively. Using annual data for 1954 through 2010, they find that:
- There is a statistically and economically significant positive relationship between contemporaneous P/E and M/O, with the latter explaining about 61% of the variation in the former over the sample period.
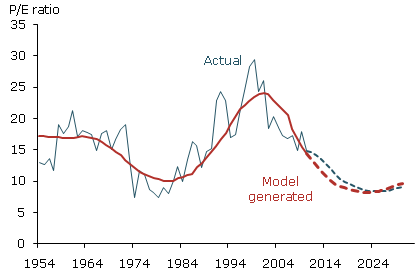
- Straightforward projection of M/O from census data enables modeling of a future trajectory for P/E, indicating that lagged P/E declines persistently from about 15 in 2010 to about 8.4 in 2025 before recovering to 9.1 in 2030 (see the chart below).
- Incorporating an error correction factor into the model indicates that P/E declines to about 8.3 in 2025 before recovering to about 9.0 in 2030.
- Assuming steady annual real earnings growth of 3.42% (same as that for 1954-2010), real stock prices decline by a cumulative 13% from 2010 through 2021. Subsequent recovery is slow, with real stock prices not returning to the 2010 level until 2027. By 2030, modeling suggests a real value of equities about 20% higher than in 2010.
The following chart, taken from the letter, shows actual lagged P/E for the U.S. stock market and a modeled P/E based on the relationship between P/E and M/O. The model projection beyond 2010 indicates historically low valuations over the coming decade as M/O persists at historically low levels (due to aging of baby boomers).

In summary, evidence suggests that U.S. demographic trends may depress valuation of U.S. equities over the coming decade.
Cautions regarding findings include:
- Annual Census Bureau demographic estimates are dated July 1, representing a six-month offset from year-end calculation of P/E. No estimate is yet available for 2010, although comparable data from the 2010 census is available.
- There may be data snooping bias in the definition of M/O, deriving from iterative consideration of alternative definitions posited from consumption and investment rationales (including alternatives known from related past research).
- The sample is very small in terms of number of generations (demographic behaviors may not be stable across generations as experience sets change and the socioeconomic environment evolves).
- Annual estimates of census age demographics are apparently as-revised rather than as-released, at least within decades, so an investor operating in real time may calculate different values for M/O than those used in the paper. Also, the availability of age demographics, earnings and inflation data all lag measured intervals by weeks or months.
- Statistical significance tests assume that the P/E distribution is tame. To the extent that this distribution is wild, the test loses validity.
See “Classic Research: Demography and the Stock Market”, “A Long Run Demographic Stock Market Outlook” and “What About the Paper ‘S&P 500 Returns Revisited’?” for related research.