The conventional binary animal metaphor for markets is bull (good returns, low volatility) and bear (poor returns, high volatility). Does rigorous analysis of empirical evidence support belief in (just) two market states? In their September 2011 paper entitled “The Number of Regimes Across Asset Returns: Identification and Economic Value”, Mathieu Gatumel and Florian Ielpo apply a regime-switching model and Monte Carlo simulations to determine the likely number of regimes implicit in the returns of 19 asset classes. Their general approach is to increase the number of regimes included in the model until adding a regime no longer materially improves the fit of the model to the actual return distribution. In other words, among statistically equivalent models, they always choose the one with the smallest number of regimes. They discuss the persistence of and performance under each regime discovered. Using weekly return data for various stock and bond indexes, currency exchange rates and commodity indexes over the period April 1998 through mid-December 2010 (650 weeks or 12.5 years), they find that:
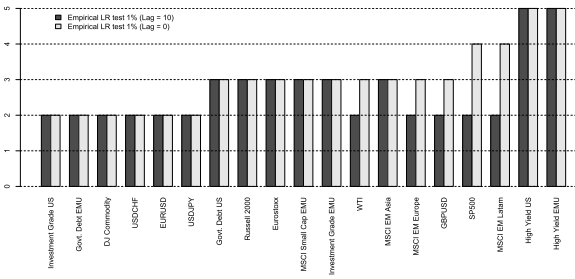
- Over the sample period, the number of regimes required to describe asset return distributions ranges from two for exchange rates, commodities and investment grade bonds to three for many equity indexes to five for high yield bonds (see the chart below).
- Most of the assets exhibit the same number of regimes across subperiods. However, while the S&P 500 Index exhibits two regimes during 1998-2010, a third state emerges during 2007-2008 and 2007-2010 subperiods.
- Asset classes driven by:
- Two regimes tend to have two very persistent states.
- Three regimes tend to have one very persistent state and two transitory states.
- More than three regimes always have two persistent states, with the other states often transitory.
- A strategy of allocating funds based on the number of regimes evidenced in past data improves out-of-sample investment performance for 15 of 19 asset classes in comparison to a default two-regime strategy. This refinement works best for asset classes with the largest number of empirical regimes.
The following chart, taken from the paper, presents the estimated number of regimes for each of the 19 asset classes over the entire sample period for two modeling assumptions. The main conclusion is that most asset classes exhibit more than two return regimes. Consistency of results for the two modeling assumptions suggests robustness.

In summary, evidence from complex modeling suggests that investors may be able to improve asset class allocation performance by letting data determine the number of return regimes for each class (rather than assuming that bull and bear states explain behaviors of all asset classes).
Cautions regarding findings include:
- A 12.5 year sample seems small compared to secular trends that plausibly might disrupt market regime behaviors.
- Methods are complex and likely inaccessible to many investors.