What do basic U.S. stock market return statistics say about consistency of equity risks and predictability of returns? We define basic statistics as first through fourth moments of the return distribution: mean (average), standard deviation, skewness and kurtosis. For tractability, we calculate these four statistics month-by-month based on daily returns. Using daily closes of the Dow Jones Industrial Average (DJIA) since January 1930 and the S&P 500 Index since January 1950, both through September 2018, we find that:
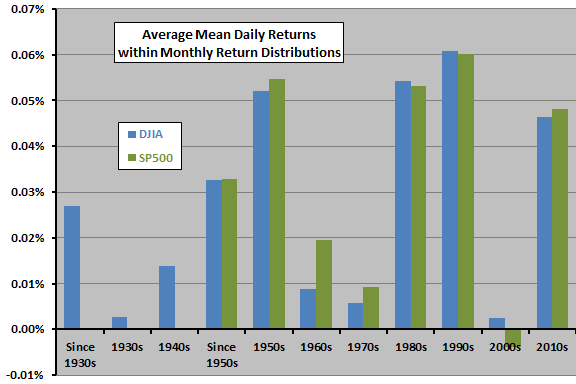
The following chart summarizes averages of mean daily returns by month for the U.S. stock market over full sample periods and decade-by-decade (with 2010s partial). It shows that the investing environment varies based on average return, with the 1950s, 1980s, 1990s and 2010s standing out as “easy” decades and the 1930s, 1970s and especially the 2000s standing out as “hard” decades. In other words, reward from passively investing in equities varies considerably over fairly long subperiods.
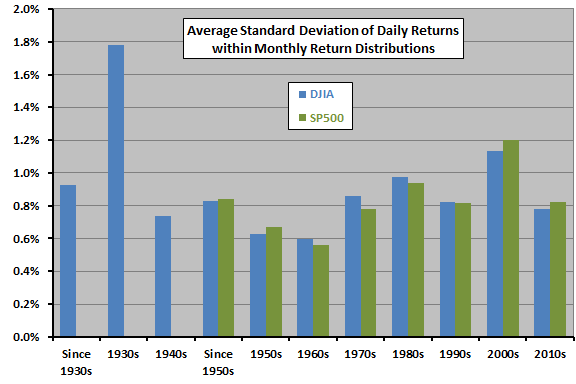
The next chart summarizes averages of standard deviation of daily returns by month for the U.S. stock market over full sample periods and decade-by-decade (with 2010s again partial). It shows that the investing environment varies also based on return volatility, with the 1950s and the 1960s being “calm” decades and the 1930s and the 2000s standing out as “jumpy” decades. The 2010s so far are about typical. In other words, risk measured by return volatility varies over fairly long subperiods.
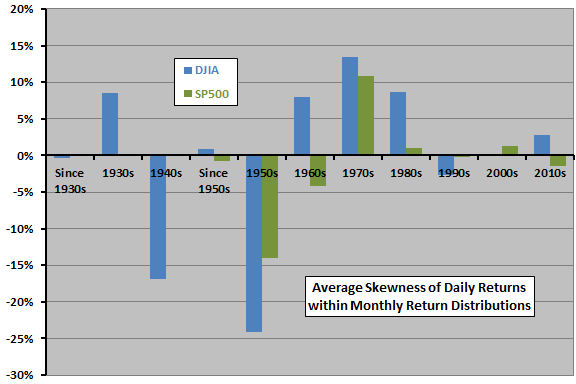
The next chart summarizes average skewness of daily returns by month for the U.S. stock market over full sample periods and decade-by-decade (with 2010s again partial). It shows that the investing environment also varies considerably based on this measure of distribution asymmetry, with the 1940s and 1950s notable for negative skewness (long left tail) and the 1970s notable for positive skewness (long right tail). The 2010s so far are mixed. In other words, skewness risk varies considerably over fairly long subperiods.
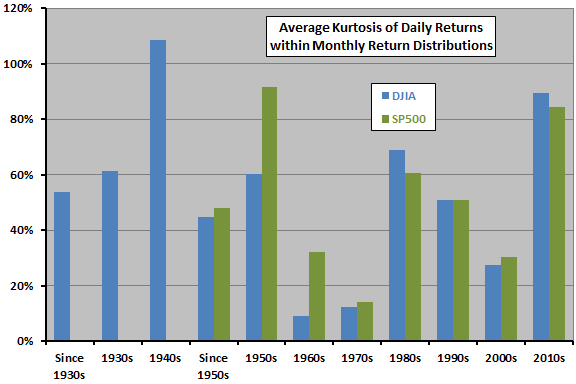
The next chart summarizes average kurtosis of daily returns by month for the U.S. stock market over full sample periods and decade-by-decade (with 2010s again partial). It shows that the investing environment varies also based on this measure of return distribution fat-tailedness, with the 1940s, 1950s, 1980s and 2010s standing out as “fat-tailed” and the 1960s and 1970s standing out as “normal” decades. in other words, kurtosis risk varies over fairly long subperiods.
Do the statistics of monthly stock market return distributions predict next-month returns?
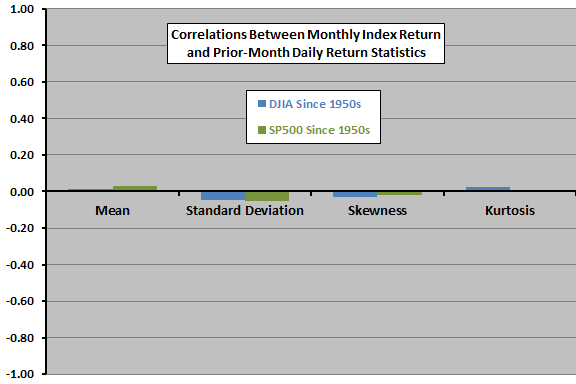
The next chart summarizes correlations between DJIA and S&P 500 Index monthly returns and the above four statistics for daily returns for the preceding month since the 1950s. Correlations are small, suggesting that daily return statistics for a given month have little or no power to predict next-month stock market behavior. The strongest, but still weak, indication is a negative relationship between return volatility (standard deviation) last month and return next month.
Are these relationships stable over time?
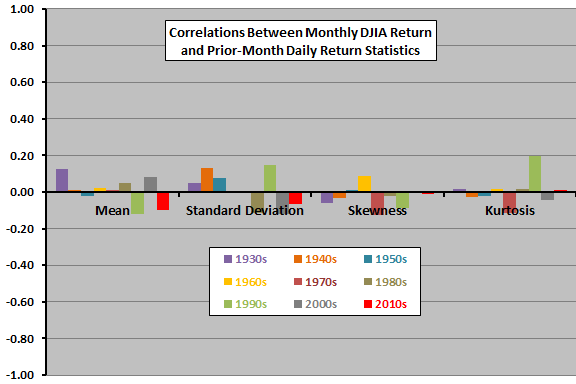
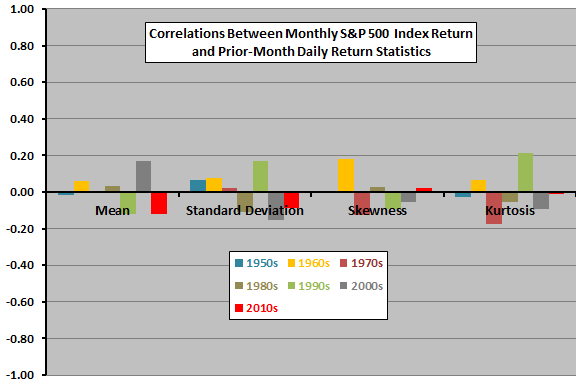
The final two charts summarize correlations between DJIA monthly returns (upper chart) and S&P 500 Index monthly returns (lower chart) and the above four statistics for daily returns for the preceding month by decade since the 1930s and 1950s, respectively (with 2010s again partial). Relationships between last month’s daily return statistics and this month’s return are generally not stable across decades.
In summary, evidence from simple statistics suggests that investors should not count on the long-run stability of the equity investing environment or on the reliability of relationships between past return statistics and future returns.
By extension, investors may want to demand a fairly high level of proof that more specialized stock return indicators offer reliable predictive power.
Cautions regarding findings include:
- The sample for the 2010s could still change as new data become available.
- Other ways of measuring the four moments of equity index returns (for example, measuring by year rather than by month) may produce different results.