Is the aggregate effect of technical trading visible and exploitable at the equity index level? In his March 2007 paper entitled “The Interaction between the Aggregate Behavior of Technical Trading Systems and Stock Price Dynamics”, Stephan Schulmeister investigates how S&P 500 Index futures prices relate to the aggregate trading signals of 2,580 widely used trend-following and contrarian technical trading rules (moving average, momentum and relative strength) implemented with 30-minute data. Using 30-minute data for S&P 500 Index futures over the period 1983-2000, he finds that:
- Technical trading in aggregate often exerts up or down pressure on the stock market because technical rules produce reinforcing clusters of long or short trading signals.
- The phases of the signal aggregation process are (see the figure below):
- News triggers a price trend up or down initiated by traders who key on economics or politics.
- After one to three 30-minute intervals, trend-following rules start to generate a sequence of signals over a period of ten to 20 intervals (one to two days) that reinforce the trend (if uninterrupted by “new” news), as though the technical traders were herding.
- After 90% of the rules have signaled, stock prices continue to trend for five to ten 30-minute intervals, perhaps due to amateurs jumping on the bandwagon. These latecomers are the enablers of successful technical trading and probably the biggest losers in stock futures trading.
- Once trends lose momentum, contrarian technical rules contribute to onset of reversal.
- More than 85% of the rules hold a long (short) position during about 18% (16%) of the 30-minute intervals over the entire sample period. In contrast, rules roughly balance between short and long only about 9% of the time.
- Technical trading is intense (more than 15% of the rules generating signals within a 30-minute interval) during about 3% of all intervals.
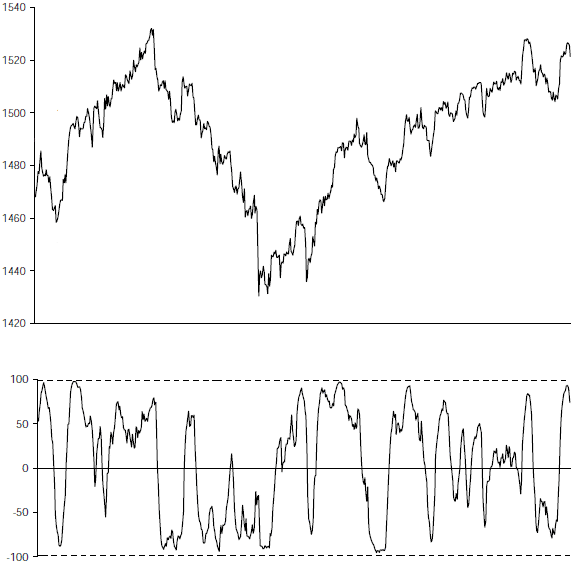
The following chart, taken from the paper, relates the behavior of S&P 500 Index futures prices in the upper graph to the aggregate position of the 2,580 technical trading rules from 100% long (100) to 100% short (-100) in the lower graph during July and August 2000. Upward (downward) price reversals cause rules to change their positions from short to long (long to short), and continuations of trends cause rules to hold their positions.

In summary, technical trading rules in aggregate generate positive feedback that strengthens and lengthens stock market trends and are thus destabilizing. The continuation of trends after most or all rules have “flipped” suggests a bandwagon effect from other traders. Monitoring technical models helps form expectations about the expectations of other traders.
Note that:
- The author suggests that understanding and quantifying the aggregate technical trading trend feedback mechanism is useful to traders, but the paper offers no test of usefulness.
- More recent data would be interesting. The 2001-2006 out-of-sample results described in“Market Evolution to Higher-frequency Inefficiency?” suggest that the interactions described above may have accelerated to speeds not revealed by a 30-minute measurement interval.
- “A Few Notes on Trading the Trader” summarizes key points from a 2010 book addressing exploitation of aggregate technical trading.