Do investors in aggregate respond to “staged” CEO visibility? In the August 2011 update of their paper entitled “CEO Interviews on CNBC”, Felix Meschke and Andy Kim investigate whether planned interviews with CEOs on financial television systematically affect associated stock prices over the days before and after the interview. The authors focus on the interval from two trading days before through ten trading days after interview date. Using daily stock price and trading data associated with 6,937 CEO interviews broadcast on CNBC during June 1997 through December 2006 (9.5 years), along with contemporaneous CNBC viewership levels and corporate news, they find that:
- There is an average gross abnormal return (adjusted for market, size, book-to-market and momentum factors) of 1.62% on unusually high trading volume from two trading days before the interview through the interview date, about equally split between the two days before the interview (0.84%) and the interview date (0.79%). There is subsequently a strong reversal of -1.08% over the next ten trading days.
- This return pattern:
- Holds for subsamples screening out interviews potentially confounded by common company events/announcements and other company news.
- Is stronger for NASDAQ stocks versus NYSE/AMEX stocks, technology stocks versus non-technology stocks and the first half of the sample versus the second half.
- While CEO interviews are generally uninformative, CEO tone (positiveness and humor) affects stock price reaction.
- The abnormal trading volume around unconfounded CEO interviews comes from small trades associated with individual investors. Elevated short-selling indicates that some traders take advantage of these attention spikes.
- The larger the interview audience, the greater the interview peak and post-interview reversal.
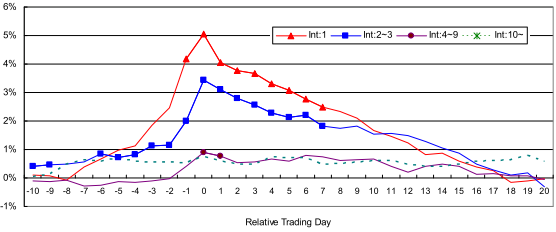
The following chart, taken from the paper, shows the average cumulative gross abnormal return for stocks associated with CEO interviews on CNBC with no contemporaneous company events/announcements from 10 trading days before (-10) to 20 trading days after (20) interview dates. The chart segments stock reactions according to the cumulative number of interviews done by the CEO. For example, the red line with triangles (Int:1) shows the average cumulative abnormal return of stocks associated with the subsample of first-time interviews. Int:2~3, Int:4~9 and Int:10~ show results for subsamples of second and third interviews, fourth through ninth interviews and tenth or more interviews with the same CEO, respectively.
Results indicate that investor attention diminishes as frequency of CEO exposure increases.

In summary, evidence from price dynamics of stocks associated with planned CEO interviews on CNBC indicates that investors may be able to exploit short-term stock price spikes and reversals associated with transitory attention of individual investors.
Cautions regarding findings include:
- As noted in the study, the interview effect is weaker in the second half of the sample, suggesting general viewer fatigue or market adaptation.
- Return calculations are gross, not net. Reasonable trading frictions for any trading strategy designed to exploit the interview effect would diminish reported returns.