Objective research to aid investing decisions

Value Investing Strategy (Strategy Overview)

Allocations for January 2025 (Final)
Cash TLT LQD SPY

Momentum Investing Strategy (Strategy Overview)

Allocations for January 2025 (Final)
1st ETF 2nd ETF 3rd ETF

Animal Spirits

Are investors and traders cats, rationally and independently sniffing out returns? Or are they cows, flowing with a herd that must know something? These blog entries relate to behavioral finance, the study of the animal spirits of investing and trading.

Panic Selling and Panic Sellers

How frequently and permanently do individual U.S. investors sell stocks in a panic? In their August 2021 paper entitled “When Do Investors Freak Out?: Machine Learning Predictions of Panic Selling”, Daniel Elkind, Kathryn Kaminski, Andrew Lo, Kien Wei Siah and Chi Heem Wong examine frequency, timing and duration of panic selling. They define panic selling as a drop of at least 90% in account equity value within a month, of which at least 50% is due to trading. They also estimate the opportunity of cost of panic selling. Finally, they apply deep neural network software to predict a month in advance which individuals will panic sell based on recent market conditions and investor demographics/financial history. Using account equity value and trade data for 653,455 individual U.S. brokerage accounts belonging to 298,556 households during January 2003 through December 2015, they find that:

Keep Reading

Herding off the Cliff at Robinhood?

Does technology amplify adverse herding among inexperienced investors? In their October 2020 paper entitled “Attention Induced Trading and Returns: Evidence from Robinhood Users”, Brad Barber, Xing Huang, Terrance Odean and Christopher Schwarz test the relationship between episodes of intense stock buying by retail (Robinhood) investors and future returns. Their source for buying intensity is the stock popularity feature of Robintrack from May 2, 2018 until discontinuation August 13, 2020 (with 11 dates missing and two hours missing for 16 other dates), during which the number of Robinhood user-stock positions grows from about 5 million to over 42 million. They define intense stock buying (herding event) as a dramatic daily increase in number of Robinhood users owning a particular stock in two ways:

  1. Among stocks with at least 100 owners at the start of the day, select those in the top 0.5% of ratio of owners at the end of the day to owners at the beginning of the day.
  2. Select stocks with at least 1,000 new owners and at least a 50% increase in owners during the day.

Using Robintrack data supporting these definitions and associated daily stock returns, open and close prices, closing bid-ask spreads and market capitalizations, they find that: Keep Reading

From Irrational to Expressive and Emotional

Are typical investors persistently irrational in pursuit of wealth, or pursuing more than wealth? In his December 2019 book entitled Behavioral Finance: The Second Generation, Meir Statman describes and discusses second-generation behavioral finance, which replaces (1) pursuit of wealth persistently retarded by cognitive shortcuts and emotional biases with (2) pursuit of normal wants including financial security, success for children and families, adherence to values, high social status, inclusion, respect and fairness (with some shortcuts and errors). These normal wants, even more than cognitive shortcuts and emotional biases, explain saving and spending, portfolio construction, asset pricing and market efficiency. Based on the body of research and his long experience in behavioral finance, he concludes that:

Keep Reading

Pervasive Effects of Preference for Lottery Stocks

Is investor attraction to high-reward/high-risk (lottery) stocks a crucial contributor to stock return anomalies? In their May 2020 paper entitled “Lottery Preference and Anomalies”, Lei Jiang, Quan Wen, Guofu Zhou and Yifeng Zhu aggregate 16 measures of lottery preference into a single long-short factor via time-varying linear combination. Examples of the 16 measures are: maximum daily return last month; average of the five highest daily returns last month; difference between maximum and minimum daily returns last month; and, skewness of daily returns the past three months. They then test the ability of this lottery preference factor to help explain a set of 19 stock return anomalies previously unexplained by a widely used 4-factor (market, size, investment and profitability) model of stock returns. They further study interactions between the lottery preference factor and 11 well-known anomalies by each month during 1980-2018 double-sorting stocks first into fifths (quintiles) based on lottery preference and then within each lottery preference quintile into sub-quintiles based on each anomaly characteristic. Using firm/stock data for a broad sample of U.S. common stocks priced over $1 during January 1962 through December 2018, they find that:

Keep Reading

COVID-19 and U.S. Stock Returns

What does the U.S. stock market at industry/firm levels say about investor expectations during and after the 2019 coronavirus (COVID-19) pandemic? In the April 2020 update of their paper entitled “Feverish Stock Price Reactions to COVID-19”, Stefano Ramelli and Alexander Wagner examine and interpret industry/firm-level reactions to COVID-19 across three pandemic phases:

  1. Incubation: January 2-17,
  2. Outbreak: January 20-February 21,
  3. Fever: February 24-March 20.

They estimate each stock’s abnormal return during these phases as its 1-factor (market) alpha minus its beta times the market excess return. They estimate alpha and beta via regression of daily excess stock returns on daily excess value-weighted market returns during 2019. They use the yield on 1-month U.S. Treasury bills (T-bill) as the risk-free rate for calculating excess return. Using daily dividend-adjusted stock prices for Russell 3000 stocks (excluding financial stocks for leverage-related analyses), market returns and T-bill yields during December 31, 2018 through March 20, 2020, they find that: Keep Reading

Pick Stocks of Firms that Tweet a Lot?

Are firms that engage the public via Twitter more expanding (via exposure) or shrinking (via adverse social media frenzy) their opportunity sets? In their January 2020 paper entitled “The Social Media Risk Premium”, Amin Hosseini, Gergana Jostova, Alexander Philipov and Robert Savickas investigate relationships between firm Twitter activity and stock return. Their data include firm Twitter presence, and level and nature of activity, as well as responses from followers. Using these Twitter data, accounting data and stock returns for all publicly held U.S. firms during 2007 through 2016 (33,445,318 tweets, generating 25,603,977 replies, 161,548,941 retweets and 265,738,508 likes), they find that: Keep Reading

Underreaction to Changes in Firm Fundamentals

Do investors systematically and exploitably underreact to deviations in firm fundamentals from recent averages? In their January 2020 paper entitled “Anchoring on Past Fundamentals”, Doron Avramov, Guy Kaplanski and Avanidhar Subrahmanyam investigate how deviations of quarterly firm accounting variables from averages over recent quarters relate to future returns across stocks. They first construct a stock performance deviation index (PDI) based on seven variables: (1) cash and short-term investments, (2) retained earnings, (3) operating income, (4) sales, (5) capital expenditures, (6) invested capital and (7) inventories. They then each month for each stock starting June 1977:

  • Calculate the deviation for each variable as the difference between its most recent quarterly value and its average over the preceding three quarters, scaled by total assets.
  • Rank each deviation (in percentiles) relative to deviations for the same variable for all stocks.
  • Calculate PDI for a stock as the equally weighted average of percentile rankings across all seven variables.

They extend this approach to a more comprehensive fundamental-based deviation index (FDI) that considers deviations of all Compustat accounting variables plus 14 commonly used accounting ratios, with weights of deviation percentile rankings optimized via least absolute shrinkage and selection operator (LASSO) regression starting January 1979. For all variables, if the exact release date is unavailable, they assume a 60-day delay in release. For portfolio tests, they calculate returns to hedge portfolios that are long (short) stocks in the top (bottom) tenth, or decile, of PDIs or FDIs, with holding intervals ranging from one to 24 months. Using monthly data needed to construct PDI, FDI and 30 style, technical, fundamental and liquidity control variables across a broad sample of reasonably liquid U.S. common stocks with positive book values and prices over $5 during January 1976 through October 2017, they find that: Keep Reading
Retail Trading Drives Stock Momentum?

Is retail trading a reliable driver of U.S. stock momentum? In his November 2019 paper entitled “Retail Trading and Momentum Profitability”, Douglas Chung investigates interactions across stocks between current proportion of retail trading and future momentum returns. Specifically, for each month and for each of two recent stock samples, he:

  • Sorts stocks into fifths (quintiles) by current proportion of retail trading.
  • Within each proportion-of-retail-trading quintile:
    • Sorts stocks into sub-quintiles by return from 12 months ago to one month ago.
    • Calculates average next-month returns for an equal-weighted momentum portfolio that is long (short) the sub-quintile of stocks with the highest (lowest) past returns. He also considers other portfolio weighting schemes.
    • Measures alphas of these returns based on various widely accepted single-factor and multi-factor models of stock returns.

He next tests whether proportion of retail trading relates to a gambling motive (lottery trading) by constructing a stock lottery index from inverse of stock price, idiosyncratic volatility, idiosyncratic skewness and recent maximum daily return. In other words, he examines whether the lottery index value for a stock is a proxy for its proportion of retail trading. Using daily data for all NYSE retail orders during March 2004 through December 2014, for small NYSE trades of U.S. common stocks (a proxy for retail trading) during January 1993 through July 2000 and for lottery index inputs during 1940 through 2016, he finds that: Keep Reading

Best Factor Model of U.S. Stock Returns?

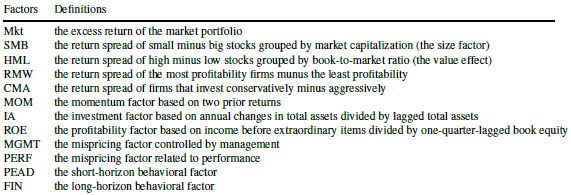
Which equity factors from among those included in the most widely accepted factor models are really important? In their October 2019 paper entitled “Winners from Winners: A Tale of Risk Factors”, Siddhartha Chib, Lingxiao Zhao, Dashan Huang and Guofu Zhou examine what set of equity factors from among the 12 used in four models with wide acceptance best explain behaviors of U.S. stocks. Their starting point is therefore the following market, fundamental and behavioral factors:

They compare 4,095 subsets (models) of these 12 factors models based on: Bayesian posterior probability; out-of-sample return forecasting performance; gross Sharpe ratios of the optimal mean variance factor portfolio; and, ability to explain various stock return anomalies. Using monthly data for the selected factors during January 1974 through December 2018, with the first 10 (last 12) months reserved for Bayesian prior training (out-of-sample testing), they find that: Keep Reading

Extra Attention to Earliest Quarterly Earnings Announcements

Does the market react most strongly to the earliest quarterly earnings announcements? In their October 2019 paper entitled “Calendar Rotations: A New Approach for Studying the Impact of Timing using Earnings Announcements”, Suzie Noh, Eric So and Rodrigo Verdi study effects of the relative order of U.S. firm quarterly earnings announcements, which vary systematically for some firms according to the day of the week of the first day of a month. Specifically, they qualify firms by identifying those firms that exhibit systematic earnings announcement schedules (such as Friday of the fourth week after quarter ends, sometimes set in firm bylaws) for at least four consecutive same fiscal quarters. They then for each firm each fiscal quarter:

  • Calculate EA Order, ranking of earnings announcement date divided by number of firms with the same fiscal quarter-end.
  • Compute change in EA Order compared to the same fiscal quarter last year, indicating a calendar acceleration or delay in announcement. Positive (negative) change in EA Order indicates delay (acceleration)
  • Examine effects of change in EA Order on media coverage (number of articles), stock trading volume and stock return from one trading day before to one trading day after earnings announcement.

Using sample of 76,622 firm-quarters during 2004 through 2017, they find that: Keep Reading

Login
Daily Email Updates
Filter Research
  • Research Categories (select one or more)