Are collectible (mint state, brilliant uncirculated or proof) U.S. coins attractive to investors as an alternative asset class? In their October 2019 paper entitled “U.S. Coins Market: Historical Performance and Anomalies”, Khaled Obaid, Kuntara Pukthuanthong and David Maslar measure historical returns within the multi-billion dollar collectible U. S. coins market and determine what investors should require and avoid when selecting coins. They also examine whether collectible coins are effective diversifiers of conventional asset classes and are useful as an inflation hedge. They construct their sample manually from bid and ask prices of U.S. penny, nickel, dime, quarter, half dollar and dollar coins as listed in the first CDN Publishing Greysheet of each calendar year. They assume that the average of bid and ask for a coin is a sale price. Using price data for 2,063 coins during 1967 through 2015, they find that:
- Average age of coins in the sample is 34.6 years, with average (median) price $1,333 (only $38.00). 22% are proofs, and 10% are part of special mint sets. Average bid-ask spread is 8%, increasing from 6.1% at the beginning of the sample period to 10.9% by the end.
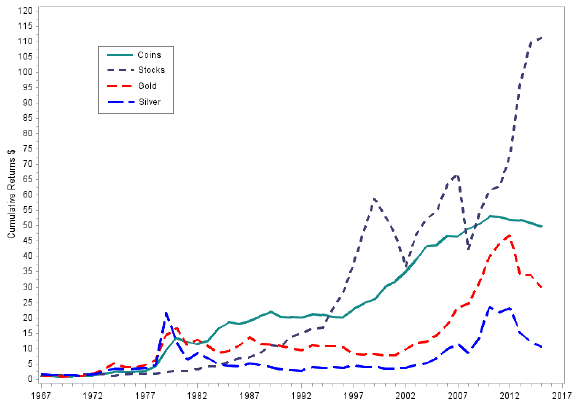
- Average annual nominal (real) return for coins is 9.7% (5.5%) with standard deviation 40.8%. Annual real returns range from -20.7% in 1981 to 105.3% in 1979 and are negative in 18 of 49 years. (See the chart below.)
- Older coins, proof sets and coins minted in smaller quantities tend to have higher prices, and higher-priced coins tend to have higher returns.
- Nominal coin market annual returns have high correlations with gold (0.72) and silver (0.72), moderate correlation with stamps (0.50), near zero correlation with the S&P 500 Index (-0.03) and negative correlation with corporate bonds (-0.27).
- Adding coins to an annually rebalanced mean-variance optimized portfolio of:
- Stocks and bonds indicates a 25% optimal weight for coins, boosting gross annual Sharpe ratio from 0.49 to 0.64.
- Stocks, bonds, gold and silver indicates a 28% optimal weight for coins, boosting gross annual Sharpe ratio from 0.59 to 0.68.
- Coins are generally effective at hedging against both expected and unexpected inflation.
- Coins exhibit cross-sectional and time series (intrinsic or absolute) momentum over intervals of one to five years.
- Newly issued coins materially underperform (for example, by -7.7% at age 2).
The following chart, taken from the paper, compares cumulative values of $1 investments at the beginning of 1967 in collectible coins, the S&P 500 Index, gold and silver. A dollar invested in coins grows to $49.90 by the end of 2015, compared to $30.00 for gold, $10.72 for silver and $111.22 for the S&P 500 Index.

In summary, evidence suggests that U.S. collectible coins may be an attractive long-term diversifier of conventional assets for portfolios of modest size.
Cautions regarding findings include:
- As noted, collectible coins have large bid-ask spreads, and reported returns are gross, not net. Moreover, the market may be thin (especially for rarer coins with strong returns), such that trading large positions would materially affect price. These coins may therefore be suitable only for small investors with very long investment horizons. In addition:
- The effort required to research and execute coin trades may be substantial.
- A coin collection requires physical storage with associated costs and risk of damage/loss.
- As noted in the paper, trading volume rises and returns fall over the sample period, suggesting that expected return should be materially lower than the full sample average. Also, the extraordinarily positive return for coins in 1979 may be an outlier that distorts expectations.
Browse the Aesthetic Investments category for analysis of other kinds of collectibles.