A reader asked: “Would you be willing to test or comment on the 8/14 Wall Street Journal article ‘Hindenberg Omen Flashes’?” The Hindenburg Omen is a complex technical signal that, including confirmation via clusters of signals, consists of simultaneous satisfaction of five rules for NYSE stocks. Different informal sources indicate some variation in the rules among practitioners. For the sake of consistency in rule application, we consider the “confirmed” Hindenburg Omens cited by Robert McHugh in his 8/21/10 article entitled “We Get An Official Confirmed Hindenburg Omen On August 20th, 2010”. This article states that, after Hindenburg Omens, “plunges can occur as soon as the next day, or as far into the future as four months.” Using the dates of the Hindenburg Omens reported in these articles and weekly closing levels of the S&P 500 Index during 1/3/86 through 8/13/10, we find that:
We make the following adjustments to the dates of confirmed Hindenburg Omens as listed in the cited article:
- Exclude one of the duplicate listings for 6/20/02.
- Replace the out-of-order listing of 2/22/98 with the date of 12/23/98 in the associated footnote (which would be in order).
Note that the maximum drawdown listed in the cited article after the Hindenburg Omen date of 6/6/08 falls outside the specified four-month horizon for omen effectiveness. In general, the post-omen maximum drawdowns appear to derive from intraday data for the Dow Jones Industrial Average over intervals ranging from one day to 276 days. Four of the omen dates have four-month horizons that overlap with four-month horizons of other omen dates.
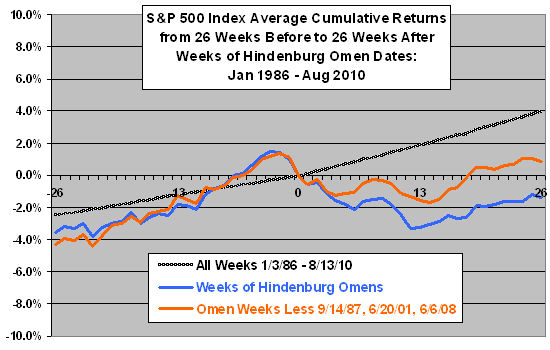
The following chart plots the average cumulative returns of the S&P 500 Index from 26 weeks before (-26) to 26 weeks after (26) a given week for three sets of weeks:
- As a benchmark, all weeks during 1/3/86 through 8/13/10.
- All weeks during which a Hindenburg Omen occurs.
- As a reliability test, all weeks during which a Hindenburg Omen occurs except those with the three most extreme subsequent market behaviors, corresponding to the October 1987 crash, the 9/11/01 terrorist attack and the Fall 2008 crash.
Results suggest that the market tends to be relatively weak after Hindenburg Omens, with weakness at nadir typically about a quarter after the omen. The three most extreme cases of weakness account for roughly half the average weakness. This material effect of 3 out of 27 Hindenburg Omens indicates that the sample is very small for confident inference.
These results may be largely in-sample (discovered retrospectively and perhaps via data snooping). Is there a way to test out-of-sample?

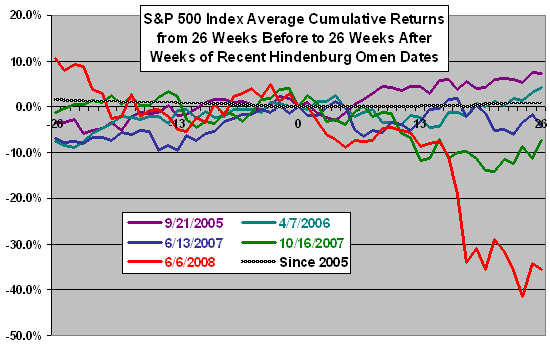
As a very limited arguably out-of-sample (arguably snooping-free) test, the next chart plots the average cumulative return of the S&P 500 Index from 26 weeks before to 26 weeks after the weeks of the five individual Hindenburg Omens since the beginning of 2005 (apparently after widespread reporting of the Hindenburg Omen). Two of the five cases exhibit notable post-omen weakness about a quarter after the omen dates.
Based on variability in results, this subsample of five occurrences is far too small for reliable inference.

Reasons to reserve belief about the effectiveness of Hindenburg Omens are:
Connecting the complex set of rules comprising the Hindenburg Omen to a rigorously tested theory of investor/market behavior is problematic.
As noted above, the sample of 27 “confirmed” Hindenburg Omens is very small for confident inference. In other words, even if the distribution of returns is normal, just a few additional occurrences of the omen could materially change the average results after all Hindenburg Omens.
Signal complexity suggests the potential for extreme fitting of rules to historical data in the process of discovering the Hindenburg Omen. Correction of the associated data snooping bias requires (impossibly?) knowing the number of alternative rules/parameter settings directly and indirectly considered and rejected in this discovery process. The more alternatives considered, the greater the probability that the omen outcomes derive from luck rather than reliable tendency. (See the notes for Chapter 6 in “Evidence-Based Technical Analysis: Applying the Scientific Method and Statistical Inference to Trading Signals (Chapter-by-Chapter Review)” for further discussion of correcting for data snooping bias.)
There are aspects of looseness in the omen evaluation approach described in “An Update on the October 2007 The Hindenburg Omen” with respect to trader exploitation, as follows:
- As noted above, the dramatic plunge after the 6/6/08 omen occurs outside the four-month omen effectiveness horizon specified in the cited article.
- An investor would not know which signal within a cluster of Hindenburg Omens is the best one to trigger a trade (picking the last signal in a cluster requires perfect hindsight).
- In the absence of a precise signal that a decline signaled by a Hindenburg Omen has bottomed, an investor could not capture the declines described (capturing the full declines requires perfect hindsight).
In summary, evidence from simple tests of a publicly available set of “confirmed” Hindenburg Omens suggests the possibility of usefulness, but reservations regarding small sample size and potential sample bias are strong.
The vivid image evoked by the name may be an important factor in investor and media attention to the Hindenburg Omen.