Does unreliability of the relationship between reported earnings and cash flow affect stock valuation? In the July 2010 version of their paper entitled “The Accrual Volatility Anomaly”, Sati Bandyopadhyay, Alan Huang and Tony Wirjanto investigate whether the market penalizes firms that consistently report earnings that are different from cash flows, as measured by accrual volatility. They define accrual volatility as the standard deviation of the ratio of accruals to sales over the past 16 quarters. They focus on total accruals, defined as changes in working capital minus deprecation and amortization.Using quarterly accounting data and monthly stock returns for a broad sample of U.S. stocks over the period 1976-2008, they find that:
- Companies tend to absorb cash flow shocks via accruals rather than earnings.
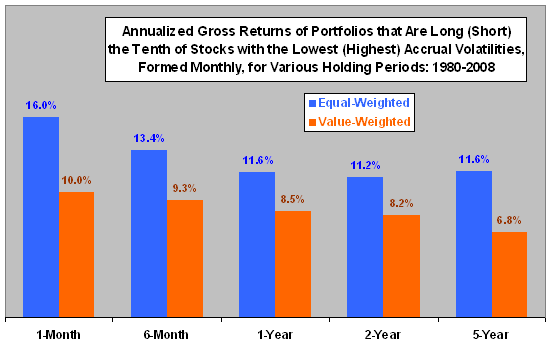
- There is a strong and long-lasting negative relationship between accrual volatility and future stock returns that derives from both underpricing of stocks with low accrual volatilities and overpricing of stocks with high accrual volatilities. A hedge portfolio that is long (short) the tenth of stocks with the lowest (highest) accrual volatilities, reformed monthly, generates an annualized, risk-adjusted return of about 10% consistently over horizons ranging from one month to five years (see the chart below). More specifically:
- For a one-month holding period, this hedge portfolio generates a gross monthly return of 1.36% on an equal-weighted basis and 0.86% on a value-weighted basis.
- The corresponding four-factor (market, size, book-to-market, momentum) monthly alpha spreads are 1.07% and 0.75%, respectively.
- Firms in the lowest and highest tenths of accrual volatility tend to stay in those extremes for a long time, resulting in relatively low trading frictions. With estimated trading frictions, these monthly alpha spreads decline to about 0.84% and 0.68%, respectively.
- During 1980-2008, the average gross return spread by calendar year is negative in only five (seven) of 29 years for equal-weighted (value-weighted) portfolios, and the magnitude of the negative spread is large for just two years for both weightings.
- This accrual volatility effect is distinct from the accrual anomaly. While the accrual anomaly focuses on one-period deviation of earnings from cash flows, accrual volatility reflects consistent deviation of earnings from cash flows. On average, only 9% of firms in accrual volatility-ranked deciles fall into the same accrual-ranked deciles.
- Results extend to both operating accruals and discretionary accruals and are robust to liquidity, earnings momentum, earnings yield, idiosyncratic return and short-sale constraints.
The following chart, constructed from data in the paper, summarizes annualized gross returns for equal-weighted and value-weighted portfolios that are long (short) the tenth of stocks with the lowest (highest) accruals volatilities, formed monthly, for holding periods ranging from one month to five years during 1980-2008. Results show that the accrual volatility effect extends long after portfolio formation with little attenuation.

In summary, evidence indicates that investors may be able to earn abnormal returns by exploiting systematic outperformance (underperformance) of stocks with very low (high) historical accrual volatilities.