What are the momentum and reversion patterns for stocks that have been consistent past winners or losers? In his June 2010 paper entitled “Does Bad Economic News Play a Greater Role in Shaping Investors’ Expectations than Good Economic News?”, Abdulaziz Alwathainani investigates the relationship between the consistency of past monthly stock performance and future returns. He defines consistent past winners (losers) as those ranking in the top (bottom) 30% of monthly returns for at least six of the last 12 months. He defines stocks ranking in the middle 40% for at least six of the last 12 months as a consistently moderate benchmark. Using monthly return and characteristics data for a broad sample of U.S. stocks spanning 1963-2007, he finds that:
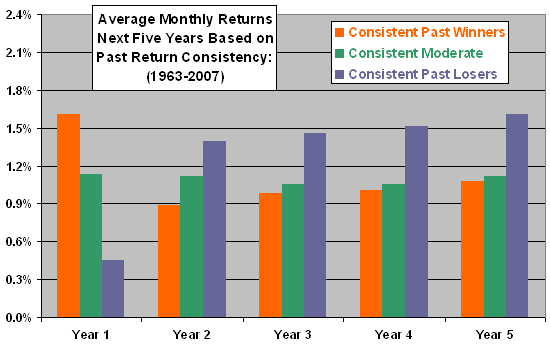
- Over the entire sample period, consistent losers exhibit stronger average return momentum during the first year after portfolio formation and more pronounced and persistent average return reversal in years two through five than do consistent winners (see the chart below).
- During the first year after portfolio formation, the consistent winner (loser) portfolio outperforms (underperforms) the benchmark consistent moderate portfolio by about 0.47% (0.69%) per month.
- In years two through five after portfolio formation, the consistent winner (loser) portfolio marginally underperforms (substantially outperforms) the benchmark consistent moderate portfolio.
- Results generally suggest that investors overreact asymmetrically to past performance of consistent winners and losers over the intermediate term (one year) and subsequently correct asymmetrically over the long term (two to five years), with intermediate positive and long-run negative autocorrelations in returns distinct components of price evolution.
- The consistent loser portfolio exhibits a strong counter-tendency (gain) in January of the first year after formation. The bulk of long-term return reversal concentrates in January, particularly for the consistent loser portfolio.
- Results are robust to the Fama-French three-factor (market, size, book-to-market) model and the momentum factor. Specifically, the momentum factor does not subsume the ability of return consistency to predict future returns.
The following chart, constructed from data in the paper shows average monthly returns of equally weighted portfolios formed each month during January 1963 through December 2002 based on consistency of past stock returns and held without rebalancing for the next five years. Results show momentum and reversal effects, with consistent past losers exhibiting stronger intermediate-term momentum and stronger long-term reversal compared to the benchmark consistent moderate portfolio than do consistent past winners.
Results do not include any trading frictions involved in forming and liquidating portfolios.

In summary, evidence indicates that investors may be able to exploit consistency of past stock performance, independently of widely used momentum measures, via continuation over the intermediate term and reversal over the long term.