A reader noted and asked: “I have seen on the net that it is better to be in large capitalization stocks when the Federal Funds Rate (FFR) target is increasing and small capitalization stocks when the FFR target is decreasing. Is there any serious study about this belief?” An argument supporting this proposition is that investors view small firms as more sensitive to changes in interest rates than large firms. Using FFR target actions and daily closes of the S&P 500 Index (representing large firms) and the Russell 2000 Index (representing small firms) for January 1990 through December 2010, we find that:
There are 31 (46) increases (decreases) in the FFR target over the sample period, with the first (last) falling on 7/13/90 (12/16/08).
Assumptions for analysis are as follows:
- The FFR target is increasing (decreasing) if the most recent action is up (down).
- Position switches indicated by changes in FFR target direction take place at the close on the target announcement dates.
- Start the analysis at the close on the date of the first FFR change during the sample period (7/13/90).
- There are only eight changes in FFR direction, so ignore trading frictions.
- Ignore dividends. The yield on the S&P 500 (Russell 2000) Index is currently about 1.86% (1.08%), and the sample period, so this assumption favors small capitalization stocks.
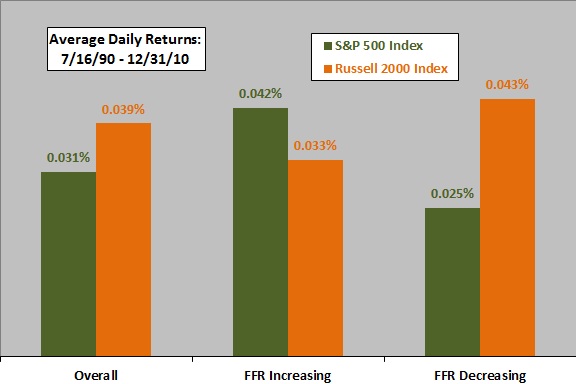
The following chart presents the average daily returns for the S&P 500 Index and the Russell 2000 Index and the returns for these indexes when the FFR target is increasing and decreasing over the period 7/16/90 through 12/31/10. Results suggest that large (small) capitalization stocks do better when the FFR target is increasing (decreasing) as proposed, with the effect more pronounced for large capitalization stocks.
Relative performance is not sensitive to moving trend change dates back one day (to the close before announcement date) or to excluding data since last FFR target change in the sample (12/16/08).
Standard deviations of daily returns are somewhat smaller for both indexes when the FFR target is increasing than when it is decreasing, but the Russell 2000 Index is more volatile than the S&P 500 Index in both cases.
Cumulative performances offer a different perspective.

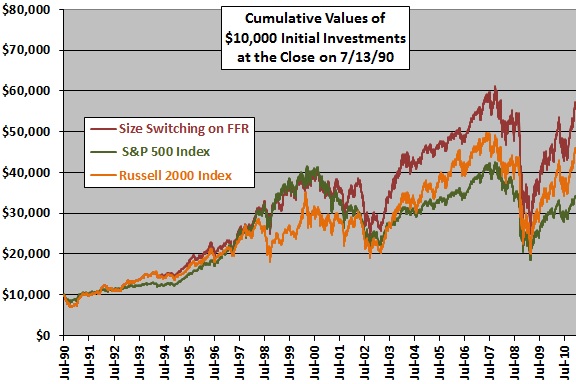
The next chart plots the cumulative values of $10,000 initial investments at the close on 7/13/90 for:
- Holding the S&P 500 Index (Russell 2000 Index) when the FFR target is increasing (decreasing). This strategy generates eight switches in indexes over the 21-year sample period.
- Buying and holding the S&P 500 Index.
- Buying and holding the Russell 2000 Index.
Results show that the switching strategy produces the highest terminal value, with most of its advantage accrued between late 2001 and early 2004 (switching does not beat the Russell 2000 Index for a contest started on 3/31/04).
The average daily return for the switching strategy is 0.042%, compared to 0.031% and 0.039% for the S&P 500 Index and the Russell 2000 Index, respectively. The standard deviation of daily returns for the switching strategy is 1.31%, compared to 1.18% and 1.38% for the S&P 500 Index and the Russell 2000 Index, respectively. However, the average daily return of the switching strategy is lower than that of the S&P 500 Index during the first half of the sample (through 2000) and lower than that of the Russell 2000 Index during the second half of the sample.

Sample size is very small in terms of number of economic cycles, arguably the driver of changes in FFR direction. The inception date of the Russell 2000 Index allows pushing the analysis start date back to 9/10/87, but information about FFR changes is less precise before 1990.
In summary, evidence from simple tests on a small sample offers weak support for a belief that large (small) capitalization stocks fare better when the Federal Funds Rate target is increasing (decreasing).