Can technical (price) analysis usefully identify major bubbles and anti-bubbles in financial markets? In the May 2009 version of their paper entitled “A Consistent Model of ‘Explosive’ Financial Bubbles With Mean-Reversing Residuals”, Lin Li, Ruoen Ren and Didier Sornette model bubbles. In their March 2010 paper entitled “Diagnosis and Prediction of Market Rebounds in Financial Markets”, Wanfeng Yan, Ryan Woodard and Didier Sornette similarly model anti-bubbles. Using daily levels of various financial market indexes, they conclude that:
In “A Consistent Model of ‘Explosive’ Financial Bubbles With Mean-Reversing Residuals”, the authors model the interaction of rational traders and noise traders via three components: (1) an overall faster-than-exponential (power law) acceleration of price; (2) an overlay of accelerated transient increases and corrections; and, (3) mean reversion of deviations from the combination of (1) and (2). The model reflects a “key insight…that spontaneous patterns of organization between investors emerge from repetitive interactions at the micro-level, possibly catalyzed by top-down feedbacks provided for instance by the media and macro-economic readings, which are translated into observable bubble regimes and crashes.” Using daily levels of the S&P 500 Index and other market indexes, they find that:
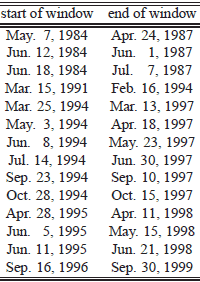
- The model correctly identifies S&P 500 Index bubbles ending in October 1987, October 1997, August 1998 and the first quarter of 2000 (see the table below).
- The model enables estimation of bubble duration. For example, the bubble associated with the October 1987 crash commenced at least four years earlier.
- The model detects seven other major bubbles in markets around the world during the last two decades.
The following table, extracted from the paper, lists the intervals during which the model detects bubbles in the S&P 500 index between January 3, 1950 to November 21, 2008. The model does not find a bubble associated with the 2007 market peak and 2008 crash.
The paper does not investigate how an investor might exploit the signals listed.

In “Diagnosis and Prediction of Market Rebounds in Financial Markets”, the authors model “negative bubbles” as the mirror image of financial bubbles. “In a negative bubble, the positive feedbacks reflect the rampant pessimism fueled by short positions leading investors to run away from the market which spirals downwards also in a self-fulfilling process.” Using rules that generate 11,662 test intervals for the S&P 500 Index over the period January 1950 through May 2009, they conclude that:
- Negative bubble indications exist for about 22% of the S&P 500 Index test intervals.
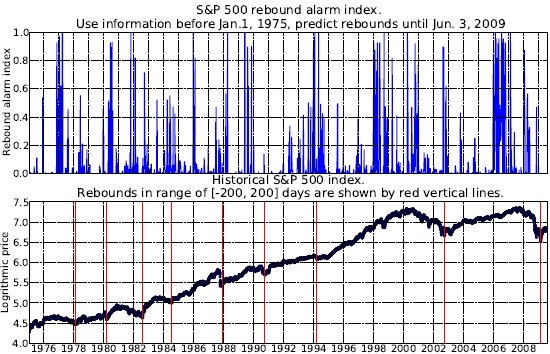
- A “rebound alarm index” derived from pattern recognition algorithms trained with pre-1975 data isolates a subset of negative bubble indications that correlates reasonably well with actual index rebounds since 1975 (with some false alarms and some missed rebounds).
- Trading strategies that buy (sell) the S&P 500 Index when the rebound alarm index rises above (falls below) specified thresholds, with specified trading lags, generally perform well compared to random timing strategies with matched total holding periods.
The following charts, taken from the paper, show the rebound alarm index (upper chart) and log-price (lower chart) for the S&P 500 Index during a forward test from January 1975 through May 2009. The higher the rebound alarm index, the more likely a rebound. Red vertical lines on the lower chart indicate actual rebounds, which tend to occur near clusters of high values of the rebound alarm index.

In summary, evidence from tests on a modest sample of bubbles/anti-bubbles indicates that complex technical analysis of financial markets may offer investors some edge in timing some market extremes.
Executing the complex methods in these studies would be problematic for most investors. Also, the results may be materially susceptible to data snooping bias since:
- Sample size in terms of number of bubbles/anti-bubbles is small.
- The bubble-finding rules are complex.
- Compute-intensive learning algorithms generally involve testing of many alternative specifications.