Does the low-risk stock anomaly hold for China A shares, dominated by local private investors rather than institutions and characterized by high volatility and herding? In their January 2021 paper entitled “The Volatility Effect in China”, David Blitz, Matthias Hanauer and Pim van Vliet examine the performance of low-volatility China A shares. At the end of each month, they rank these stocks into value-weighted tenths (deciles) based on volatility or market beta over the last 36 months. To ensure comparability to other widely studied factors, they then construct a volatility (VOL) factor following the Fama-French 2×3 factor portfolio construction method. To mitigate concerns about exploitability, they exclude micro-cap stocks and set size breakpoints using only large mid-cap stocks stocks. They calculate next-month excess total returns in U.S. dollars relative to the 1-month U.S. Treasury bill (T-bill) yield. For comparison, they similarly construct and measure returns for size, value, profitability, investment and momentum factor portfolios among China A shares. Using monthly total returns and monthly accounting data for all constituents of the MSCI China A Onshore Index and the MSCI China A Onshore Investable Market Index (about 1,200 stocks per month on average) and monthly T-bill yield during November 2000 through December 2018, they find that:
- Low-risk China A shares significantly outperform high-risk shares.
- The lowest-market beta decile outperforms the highest-market beta decile by a gross annualized 9.7%, with gross annualized Sharpe ratio 0.27.
- Adjusted for market beta, the lowest-volatility decile outperforms the highest-volatility decile by a gross annualized 16.1%, with gross Sharpe ratio 0.61. In other words, volatility (not market beta) drives the low-risk anomaly.
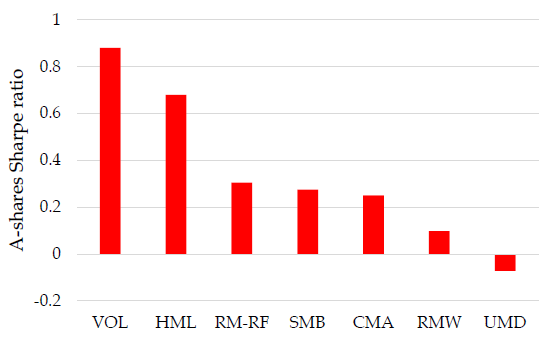
- The VOL factor generates a highly significant 9.1% gross annualized premium, with gross Sharpe ratio 0.88.
- The VOL factor generates higher gross Sharpe ratios than do the size, profitability, investment and momentum factors (see the chart below).
- Controlling for market, size, value, profitability, investment and momentum factors explains only a small part of the VOL factor premium, with residual unexplained gross annualized return 8.0%.
- Findings are robust across sectors and over time, and results are similar for shorter (as short as 1-month) and longer (up to 5-year) volatility estimation intervals.
- The VOL factor appears exploitable, with low portfolio turnover and strength among the largest and most liquid stocks.
The following chart, taken from the paper, compares gross annualized Sharpe ratios in the China A shares market during December 2000 through December 2018 for the VOL factor and for size (SMB), value (HML), profitability (RMW), investment (CMA) and momentum (UMD) factors. It also shows gross annualized Sharpe ratio for the market excess return (RM-RF). The low-risk and value premiums are the strongest factors in this market. Other factor returns are weak or absent.

In summary, evidence indicates that the equity volatility effect is pervasive geographically and across market dominated by institutions (as in the U.S.) and by private investors (as for Chinese A shares).
Cautions regarding findings include:
- As noted, performance data are gross, not net. Accounting for portfolio reformation frictions and shorting costs would reduce all returns, more for some factors than others. Frictions may be relatively high in this market. Shorting may not be feasible as specified.
- Investors may be particularly concerned about government intervention in Chinese markets, cultivating short investment horizons and perhaps overpricing volatility.
- Forming and maintaining low-risk and VOL factor portfolios is beyond the reach of most investors, who would bear fees for delegating to a fund manager.