Can machine learning software discover predictive stock price patterns? In their December 2020 paper entitled “(Re-)Imag(in)ing Price Trends”, Jingwen Jiang, Bryan Kelly and Dacheng Xiu apply convolutional neural network machine learning software to analyze stock price series images (depicting daily open, high, low, close and moving average prices and trading volume) in search of the patterns most predictive of future returns. Their model standardizes price series scales, recursively smooths and accentuates certain shape elements of images of the last 5, 20 and 60 days trading to isolate patterns that predict returns over the next 5, 20 and 60 days. They translate predictions into hedge portfolio performance by each month going long (short) the tenth, or decile, of stocks with the strongest (weakest) return forecasts. They benchmark performance against hedge portfolios for conventional momentum (return from 12 months ago to one month ago), 1-month short-term reversal and 1-week short-term reversal. Using daily price and volume series for all listed U.S. stocks during January 1993 through December 2019, they find that:
- Machine learning achieves 52%-53% out-of-sample future return direction accuracy (positive or negative) at a 1-month horizon, comparable to that for conventional momentum and higher than that for short-term reversal.
- Machine learning forecasts translate into more profitable investment strategies than benchmark forecasts.
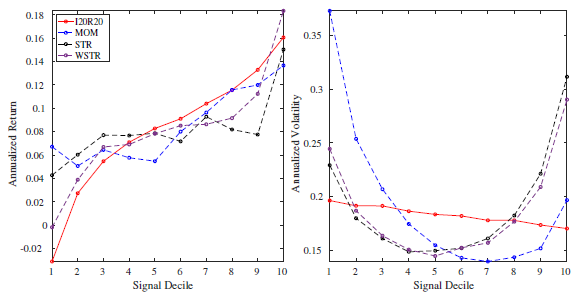
- More positive machine learning forecasts translate into higher returns more systematically and strongly than do benchmark forecasts (see the left chart below).
- All machine learning decile portfolios have annualized volatility below 20%, while those for momentum and reversal reach 30% to 35% in extreme deciles (see the right chart below).
- An extreme decile hedge portfolio based on machine learning forecasts generates annualized gross Sharpe ratios as high as 2.5 (0.6) for equal-weighted (value-weighted) portfolios. The nearest competitor among benchmark portfolios is 1-week short-term reversal, with annualized gross Sharpe ratio 1.3 (0.3) for equal-weighted (value-weighted) portfolios with about the same turnover.
- Hedge portfolio findings are generally robust:
- Across different forecast horizons, with gross Sharpe ratio stronger at shorter horizons (weekly rebalancing) than longer.
- When skipping a week between forecasts and portfolio formation.
- Patterns that are predictive for daily data yield similarly strong predictions when applied to monthly data, and patterns learned from U.S. stocks work equally well in international markets.
- A key component of image-based prediction accuracy is the implicit data scaling achieved by image representation.
- A simple and robust linear approximation of one strongly predictive machine learning pattern (for stocks closing at the low end of respective recent high-low ranges) works well. Yet the full non-linear machine learning approach generally beats the linear approximation.
The following charts, taken from the paper, show 20-day future gross average returns (left chart) and return volatilities (right chart) by equal-weighted decile of four forecast distributions:
- I20R20 – machine learning forecasts as described above for a 20-day image lookback interval.
- MOM – conventional momentum forecasts.
- STR – 1-month short-term reversal forecasts.
- WSTR – 1-week short-term reversal forecasts.
The left chart shows that machine learning average returns increase systematically and strongly from lowest to highest forecast decile, with those for WSTR next most systematic and strong. Progressions of average returns for MOM and STR are less systematic and have shallower slopes.
The right chart shows that volatilities of machine learning returns are fairly steady across deciles, in fact lowest for the highest decile. Volatilities for MOM, STR and WSTR exhibit U shapes across deciles, such that associated extreme decile hedge portfolios exhibit high volatilities.

In summary, evidence indicates that machine learning designed for image analysis may be effective in discovering stock price patterns that predict stock returns over the short term.
Cautions regarding findings include:
- Findings are gross, not net. Accounting for monthly or weekly portfolio reformation frictions and ongoing shorting costs would reduce all returns. Shorting may not always be feasible as specified. Focus on equally weighting, with attendant high trading frictions, exacerbates this concern (as emphasized by the large performance differences between equal and value weighting). There may be further material costs of acquiring machine learning software and expertise.
- The paper does not address portfolio drawdowns, which may be deep.
- Testing multiple strategies and multiple strategy variations on the same sample introduces data snooping bias, such that the best-performing alternative overstates expectations. There may be additional snooping bias in configuring the machine learning software.
- The machine learning approach is beyond reach of most investors, who would bear fees for delegating to a fund manager.
See also “Classic Papers: Returns from Pattern-Based Technical Analysis?” and “Testing the Head-and-Shoulders Pattern”.