Target-date funds (TDFs) are popular fund-of-funds retirement investments that offer asset class diversification and periodic rebalancing aimed at a specific retirement year. TDFs typically charge layers of fees (fund-of-funds fee plus fees of underlying funds). Can investors do better themselves? In their October 2020 paper entitled “Off Target: On the Underperformance of Target-Date Funds”, David Brown and Shaun Davies assess feasibility and costs of emulating TDFs with low-cost exchange-traded funds (ETF) based on publicly disclosed TDF initial portfolio allocations and dynamic adjustments (glide paths). They identify TDFs as those mutual funds with one of 2005, 2010, 2015, 2020, 2025, 2030, 2035, 2040, 2045, 2050, 2055 or 2060 in their names. They replicate TDFs by matching each of their holdings to the one of 50 Vanguard ETFs (as available when they reach $50 million in assets) with the highest full-sample monthly correlation of returns. Using monthly returns, holdings and expense ratios for TDFs and the funds they hold and monthly returns for the 50 Vanguard ETFs during January 2006 through December 2017, they find that:
- From 2006 to 2017, sample TDF assets grow from $84 billion to $745 billion, and value-weighted total fees decrease from 0.71% to 0.45%. Typically, fees of underlying funds comprise 60-80% of the total fees, with the balance fund-of-funds fees.
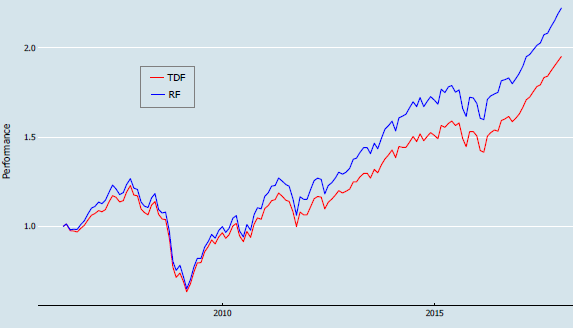
- Based on portfolio comparisons, replications outperform corresponding TDFs by an average 1.28% per year (see the chart below).
- Replications exhibit low tracking errors and require only infrequent rebalancing.
- Lower overall fees account for about two-thirds of replication outperformance, and absence of any cash drag (due to fund flows) accounts for most of the other third.
- Based on 2017 excess fees, over a 40-year investment horizon, replications would outperform TDFs by an equal-weighted (asset-weighted) 25% (14%).
- Boilerplate portfolios that aggregate holdings of all replications by vintage (such as 2030) outperform corresponding aggregate TDF portfolios by 0.82% to 1.07% per year while beating 82% to 90% of TDFs. These boilerplate portfolios have modestly higher annual Sharpe ratios than aggregate TDF portfolios (0.62 to 0.65 versus 0.58).
The following chart, taken from the paper, compares cumulative performances of $1 initial investments at the end of March 2006 in the Fidelity Freedom 2030 Fund (TDF) and its replication via Vanguard ETFs (RF). At the end of December 2017, terminal values are $1.95 for the TDF and $2.22 for the RF, a difference of 14%. The RF exhibits little tracking error relative to the TDF, with monthly return correlation 0.99.

In summary, evidence indicates that investors can usually beat target date funds by constructing and maintaining a portfolio of low-cost ETFs using the same rules.
Cautions regarding findings include:
- The sample period is not long, and TDF fees fall during it.
- As noted in the paper, using the full sample period to select replication components via return correlations introduces look-ahead bias.
- The paper does not address whether TDFs as offered in the market place are the best retirement investments.