A subscriber requested testing of a dual simple moving average (SMA) crossover strategy that holds SPDR S&P 500 (SPY) when its 30-day SMA (SMA30d, using 30 trading days) is above its 9-month SMA (SMA9m) and otherwise holds cash with yield that of 3-month U.S. Treasury bills (T-bills). To investigate, we calculate SPY SMA30d and SMA9m at the end of each month over the history of SPY and hold SPY or cash the next month as specified. As benchmarks, we consider buying and holding SPY and a strategy that is each month in SPY (cash) when SPY is above (below) its SMA9m at the end of the prior month. We focus on compound annual growth rate (CAGR) and maximum drawdown (MaxDD) as key performance metrics. We also perform some sensitivity testing on the choices of 30-day and 9-month SMAs. Using daily dividend-adjusted prices for SPY and monthly T-bill yields during January 1993 through September 2020, we find that:
We commence calculations at the end of December 1993 to accommodate a longest SMA of 12 months. We assume 0.2% frictions for switching between SPY and cash (likely too low early in the sample and too high late in the sample).
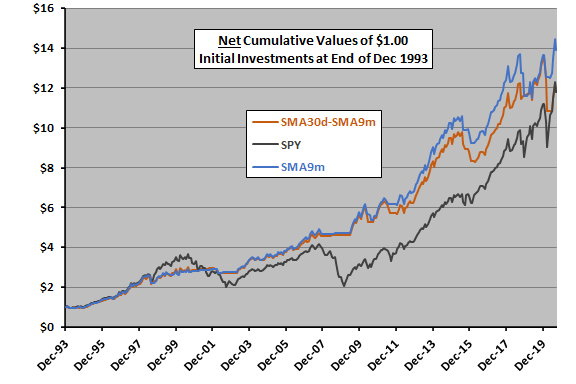
The following chart tracks net values of $1.00 initial investments in the SMA30d-SMA9m crossover strategy and in the SPY and SMA9m benchmarks over the full sample period. Notable points are:
- SMA30d-SMA9m and SMA9m perform similarly, with the latter modestly preferable.
- Both SMA strategies are mostly preferable to buying and holding SPY, largely due to avoidance of the 2008-2009 market crash. SMA30d-SMA9m appears to underperform SPY since that crash.
For perspective, we look at key performance statistics.

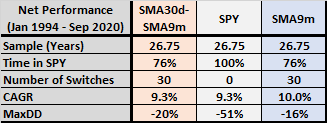
The following table summarizes key performance statistics for the SMA30d-SMA9m crossover strategy and in the SPY and SMA9m benchmarks. Notable points are:
- SMA30d-SMA9m and SMA9m are both in SPY 76% of the time. Both switch between SPY and cash 30 times (a little over once per year on average), so neither are very sensitive to assumed level of switching frictions.
- SMA9m is preferable based on both CAGR and MaxDD.
How sensitive are findings to the choices of 30-day and 9-months SMAs?

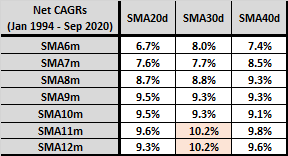
The next table summarizes CAGRs for various combinations of fast (20, 30 or 40 trading days) and slow (6, 7, 8, 9, 10, 11 or 12 months) SMAs over the full sample period. Orange shading highlights optimal combinations. Notable points are:
- The 30-day fast SMA is mostly preferable.
- Longer slow SMAs work better than shorter ones.
MaxDD, which occurs at the end of the sample period during the COVID-19 crash for dual SMA combinations, is insensitive to these variations.
Testing parameter variations on the same data introduces data snooping bias, such that the best-performing variations overstate expectations.

In summary, evidence does not support belief that the dual 30-day/9-month SMA crossover strategy is preferable to the simpler daily price/9-month SMA strategy.
Cautions regarding findings include:
- As noted, success of the SMA strategies depends largely on the presence of the 2008 financial crisis in the sample.
- As noted, the assumed constant level of frictions is a simplification that is, in this analysis, not serious.
- As noted, sensitivity testing impounds data snooping bias. There may also be snooping bias inherited from another source via the initial parameter choices.