How do U.S. non-profit endowment funds allocate and perform? In their November 2019 paper entitled “The Risk, Reward, and Asset Allocation of Nonprofit Endowment Funds”, Andrew Lo, Egor Matveyev and Stefan Zeume examine recent asset allocations and investment returns of U.S. public non-profit endowment funds. Due to the unstructured nature of asset reporting, they manually assign each asset in each fund to one of nine categories: (1) public equity; (2) fixed income; (3) private equity; (4) cash instruments; (5) hedge funds; (6) real estate; (7) real assets and real return; (8) trusts; and, (9) cooperative investments. Using tax return data encompassing 34,170 endowment funds during 2009 through 2018, they find that:
- Average net annual return for endowments over the sample period is 5.3%, compared to 13.5% for SPDR S&P 500 (SPY) buy-and-hold.
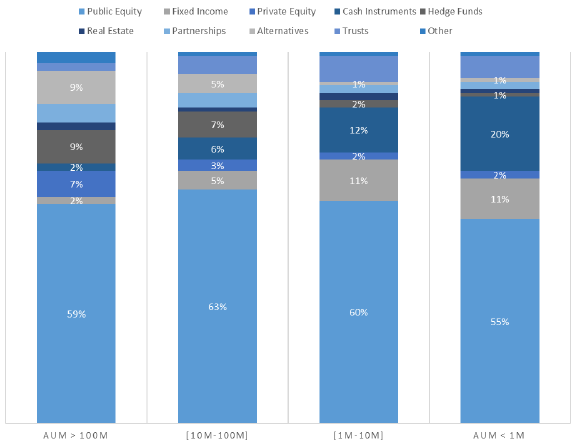
- Compared to small endowments, large ones invest less in cash and fixed income and more more in international equities, private equity, hedge funds and alternative investments (see the first chart below).
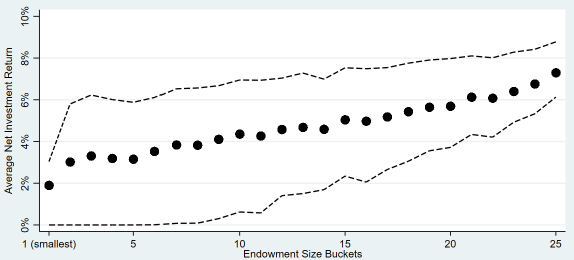
- Large funds consistently outperform small funds. Funds with more than $100 million in assets under management (AUM) have 7.6% average net annual return, compared to 3.8% for funds with AUM below $1 million (see the second chart below).
- Only 38% of endowments use investment advisors, with small endowments paying higher fees than large ones as a percentage of AUM. Endowments using advisors tend to outperform those that do not on a net basis.
- Better governance, more highly paid management, lower discretionary spending and lower investment management fees also indicate endowment outperformance.
The following chart, taken from the paper, summarizes average endowment asset allocations by AUM range over the full sample period. Results indicate that large endowments invest more aggressively (less fixed income and cash, and greater diversification into risky assets) than small endowments.
The next chart, also from the paper, summarizes endowment average net annual return by fund size, with each of 25 endowment size “buckets” having 4% of sample endowments. Dashed lines indicate returns across fund size for the 75th and 25th percentiles. Notable points are:
- Performance increases about linearly with endowment size.
- Many of the smallest endowments generate zero return.
In summary, evidence from U.S. non-profit endowments funds suggests that investors should be skeptical about emulating their strategies.
Cautions regarding findings include:
- The sample period is short and covers an exceptionally strong and long bull market for SPY.
- Average return alone is not a robust measure of investment performance.
- Emulating asset allocations of large endowments is problematic for individuals and small organizations.
For related items, see results of this search.