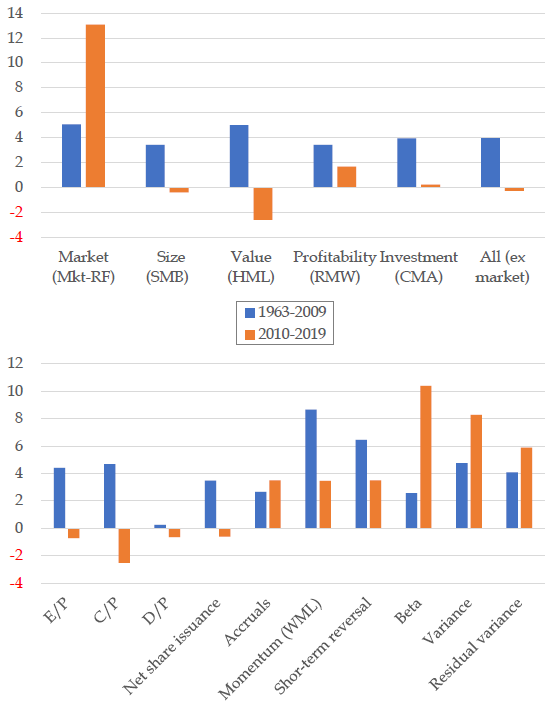
Are equity factors used in leading models of stock returns reliable performers in practice? In his March 2020 paper entitled “Factor Performance 2010-2019: A Lost Decade?”, David Blitz measures performances of factors tracked in the Kenneth French data library and the q-factor model library during 2010-2019 and compares results to their performances in prior decades. Using data from these libraries for 32 U.S. equity factors and six global non-U.S. factors over available sample periods through 2019, he finds that:
- For the four non-market factors in the Fama-French 5-factor (market, size, book-to-market, profitability and investment) model:
- Annualized average gross premium is -0.28% during 2010-2019, compared to 3.95% during 1963-2009.
- Only the profitability factor has a noticeably positive return during 2010-2019, and at only about half its pre-2010 level.
- Such a lost decade is not unprecedented, with performance in the 2010s similar to that in the 1990s (both of which decades have double-digit annualized market excess returns).
- For 10 other in the Kenneth French data library:
- Three low-risk alternatives, momentum, net share issuance, accruals and short-term reversal have positive premiums during 2010-2019. It is the second-best decade ever for low-risk (1980-1989 is best).
- The three alternative value metrics all have negative returns, as do the alternative investment factor and net share issuance.
- Results for global-ex-U.S. factors tracked in the Kenneth French data library are similar to those for U.S. factors.
- Results for factors covered in the q-factor model library generally confirm findings.
The following charts, taken from the paper, summarize annualized average gross returns for factors covered in the Kenneth French data library for two subperiods: 1963-2009 and 2010-2019. The upper chart summarizes results for factors in the widely used 5-factor model, while the lower chart addresses other factors. Notable findings for 2010-2019 are:
- 5-factor model factors do not perform well.
- Valuation ratios [earnings-to-price (E/P), cash flow-to-price (C/P) and dividend-to-price (D/P)] do not perform well.
- Three low-risk factors (beta, variance and residual variance) perform very well.

In summary, over the past decade, low-risk factors have performed exceptionally well, while those from leading factor models have not.
Cautions regarding findings include:
- Performance data are gross, not net. Accounting for periodic portfolio reformation frictions and shorting costs would reduce all returns. Shorting may not always be feasible as specified.
- Moreover, these frictions/costs may vary by factor, such that net comparisons differ from gross comparisons.