Does combining an economic growth variable trend with an asset price trend improve the power to predict stock market return? What is the best way to use such a combination signal? In his December 2019 paper entitled “Growth-Trend Timing and 60-40 Variations: Lethargic Asset Allocation (LAA)”, Wouter Keller investigates variations in a basic Growth-Trend timing strategy (GT) that is bullish and holds the broad U.S. stock market unless both: (1) the U.S. unemployment rate is below its 12-month simple moving average (SMA12); and, (2) the S&P 500 Index is below its SMA10. When both SMAs trend downward, GT is bearish and holds cash. Specifically, he looks at:
- Basic GT versus a traditional 60-40 stocks-bonds portfolio, rebalanced monthly, with stocks proxied by actual/modeled SPY and bonds/cash proxied by actual/modeled IEF.
- Improving basic GT, especially maximum drawdown (MaxDD), by replacing assets with equal-weighted, monthly rebalanced portfolios with various component selections. His ultimate portfolio is the Lethargic Asset Allocation (LAA), optimized in-sample based on Ulcer Performance Index (UPI) during February 1949 through June 1981 (mostly rising interest rates) and tested out-of-sample during July 1981 through October 2019 (mostly falling interest rates).
He considers two additional benchmarks: GT applied to the Permanent portfolio (25% allocations to each of SPY, GLD, BIL and TLT) and GT applied to the Golden Butterfly portfolio (20% to each of SPY, IWN, GLD, SHY and TLT). He applies 0.1% one-way trading frictions in all tests. Using monthly unemployment rate since January 1948 and actual/modeled monthly returns for ETFs as specified since February 1949, all through October 2019, he finds that:
- In general, GT beats the 60-40 benchmark based on compound annual growth rate (CAGR) and MaxDD during the specified out-of-sample test period/subperiods.
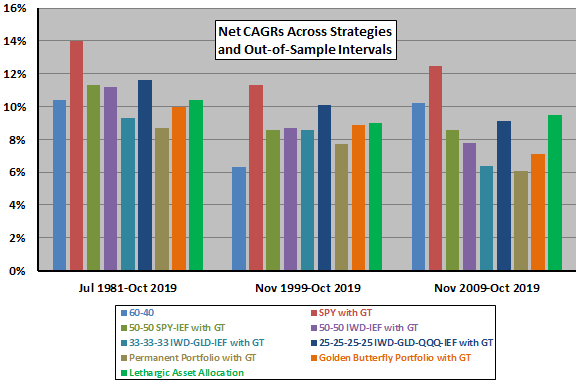
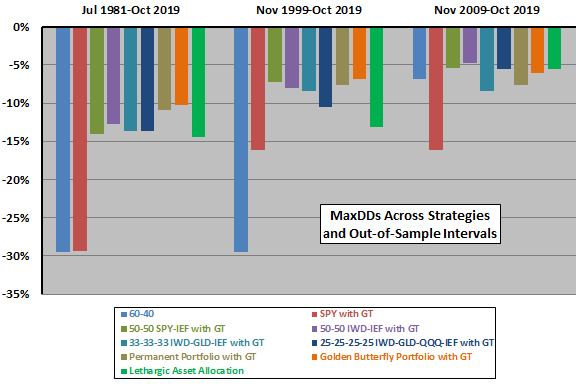
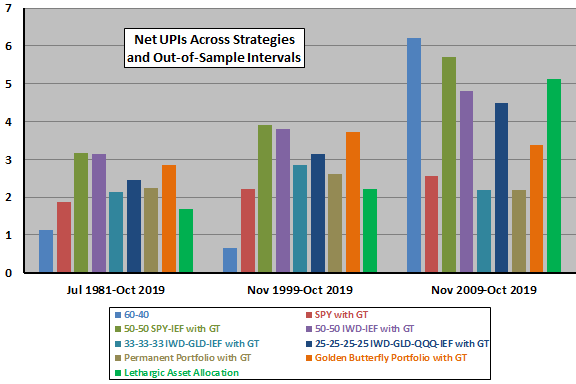
- GT beats all attempted improvements via alternative assets based on CAGR, but loses to all based on MaxDD and most based on UPI (see the charts below).
- Applying GT to the Permanent Portfolio and to the Golden Butterfly portfolio mostly does not work as well as applying GT to LAA, which has relatively very low turnover and small allocation to cash.
The following three charts, constructed from data in the paper, summarize net CAGRs, MaxDDs and UPIs for the 60-40 benchmark, GT and attempted improvements on GT over the out-of-sample test period and the last 20 and 10 years, as follows:
- 60-40: 60% allocation to SPY and 40% to IEF, rebalanced monthly.
- SPY with GT – hold 100% SPY (100% IEF) when GT is bullish (bearish).
- 50-50 SPY-IEF with GT: hold 50% SPY and 50% IEF (100% IEF) when GT is bullish (bearish).
- 50-50 IWD-IEF with GT: hold 50% IWD and 50% IEF (100% IEF) when GT is bullish (bearish).
- 33-33-33 IWD-GLD-IEF with GT: hold 33.3% each of IWD, GLD and IEF (100% IEF) when GT is bullish (bearish).
- 25-25-25-25 IWD-GLD-QQQ-IEF with GT: hold 25% each of IWD, GLD, QQQ and IEF (100% IEF) when GT is bullish (bearish).
- Permanent Portfolio with GT: hold 25% each of SPY, GLD, BIL and TLT (100% IEF) when GT is bullish (bearish).
- Golden Butterfly Portfolio with GT: hold 20% each of SPY, IWN, GLD, SHY and TLT (100% IEF) when GT is bullish (bearish).
- Lethargic Asset Allocation: hold 25% each of IWD, GLD, QQQ and IEF (25% each of IWD, GLD, SHY and IEF) when GT is bullish (bearish).
Results somewhat suggest a trade-off between CAGR and MaxDD/UPI for basic GT versus attempted improvements. Large differences in performance across subperiods suggest unreliability.


In summary, evidence suggests that investors may be able to improve risk-adjusted performance of a Growth-Trend timing strategy via use of multi-class portfolios as risky and safe assets.
Cautions regarding findings include:
- Investors with long investment horizons (high drawdown tolerance) may view CAGR as the single most important performance metric. Investors with short horizons may prefer a combination of CAGR and MaxDD, or CAGR and UPI.
- Fund data prior to inceptions of specified ETFs are modeled without regard to changing costs in fund implementation (portfolio maintenance and administration) and impacts of the existence of ETFs on market behaviors.
- Regarding assumptions about fund switching frictions:
- Switching frictions early in the sample period are much higher than 0.1%. The author states that findings for LAA are not very sensitive to level of frictions.
- Results assume zero frictions from monthly portfolio rebalancing to specified equal weights. Realistic frictions may have been material for investors of modest wealth.
- Testing multiple strategies on the same data as in the charts above introduces data snooping bias, such that the best-performing strategy incorporates luck and overstates expectations. Short test periods (such as the last 10 years) exacerbate this bias. Importing strategies from prior work incorporates any snooping bias impounded in their development.
- Strategy variations in the charts above have different dependencies on interest rate trend, which is generally downward. Relative performances may differ when interest rates rise or are stable.
- Government economic data series often include short-term revisions to the most recent values and longer-term revisions for adjustments in methodology. For example: “At the end of each calendar year, the Bureau of Labor Statistics (BLS) reestimates the seasonal factors for the CPS [Current Population Survey] series by including another full year of data in the estimation process. Following this annual reestimation, BLS revises the historical seasonally adjusted data for the previous 5 years.” Such revisions impound look-ahead bias, with historical data differing from as-released values.
See also See “Combine Market Trend and Economic Trend Signals?” and “Combining Economic Policy Uncertainty and Stock Market Trend”.