Does careful accounting for transitory expenses in SEC Form 10-Ks provide a better view of future firm/stock performance than that provided by Generally Accepted Accounting Practices (GAAP) earnings per share (EPS)? In their October 2019 paper entitled “Core Earnings: New Data and Evidence”, Ethan Rouen, Eric So and Charles Wang define Core Earnings, which adds to GAAP 10-K net non-operating expenses related to: (1) acquisitions, (2) currency exchange adjustments, discontinued operations, (4) legal or regulatory events, (5) pension adjustments, (6) restructuring, (7) gains and losses designated “other” by firms and (8) other unclassified gains and losses deemed non-operating. Using a dataset compiled by a combination of human analysts and machine learning that identifies and classifies quantitative disclosures in 10-Ks of Russell 3000 firms, and associated stock prices, during 1998 through 2017, they find that:
- The frequency of non-operating income/expense disclosures increases significantly over the sample period, from fewer than four per firm in 1998 to about eight in 2017. The average adjustment in 2017 is 26 cents per share per firm in 2017, representing about 15% of average GAAP EPS.
- Core EPS is more persistent than conventional earnings metrics, with cross-sectional year-to-year autocorrelation 0.82, compared to 0.64 for GAAP EPS and 0.69 for a widely used version of operating EPS.
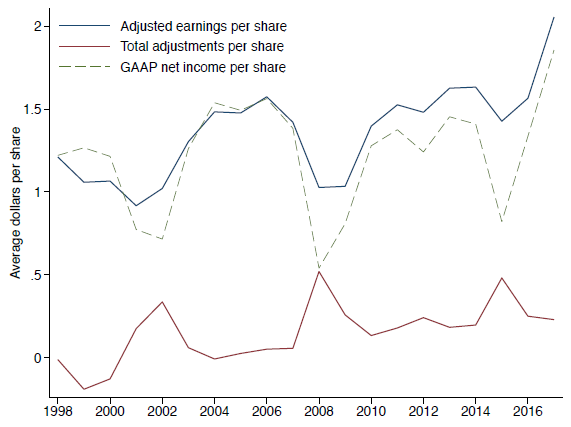
- The difference between Core EPS and GAAP EPS (“total adjustments per share” in the first chart below) relates positively to analyst earnings forecast revisions and stock returns over the next year, even after controlling for size, book-to-market, gross profitability, accruals and momentum.
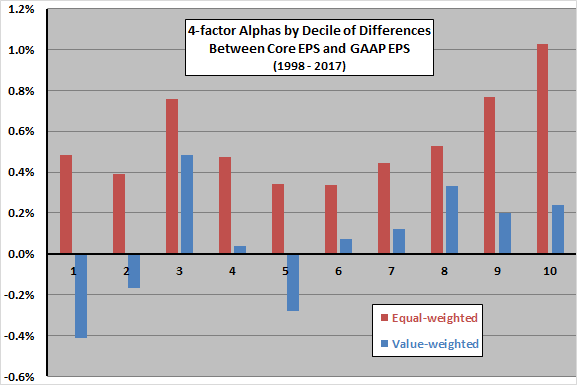
- A portfolio that is long the value-weighted tenth, or decile, of stocks with the largest differences between Core EPS and GAAP EPS and short the decile with the smallest, reformed when firms file 10Ks, generates gross monthly 4-factor (market, size, book-to-market, momentum) alpha 0.65%. (See the second chart below.)
The following chart, taken from the paper, tracks over the sample period:
- Core EPS (Adjusted earnings per share).
- The difference between Core EPS and GAAP EPS (Total adjustments per share).
- GAAP EPS (GAAP net income per share).
Core EPS is smoother than GAAP EPS, with adjustments most pronounced during times of market turmoil. Core EPS is on average larger than GAAP EPS, perhaps due to GAAP conservatism.

The next chart, constructed from data in the paper, summarizes equal-weighted and value-weighted 4-factor alphas by decile of differences between Core EPS and GAAP EPS over the full sample period. Notable points are:
- While higher deciles mostly outperform lower deciles, irregularities across deciles undermine the finding that net non-operating expenses (differences between Core EPS and GAAP EPS) reliably predict stock alphas.
- The dramatic difference between equal-weighted and value-weighted results indicates strongly different behaviors between small stocks and large stocks.

In summary, evidence suggests that Core Earnings (GAAP earnings plus net non-operating expenses) has some advantages over GAAP and conventional operating earnings in predicting U.S. stock returns.
Cautions regarding findings include:
- Analyses of exploitability are gross, not net. Accounting for costs of data, portfolio rebalancing and shorting would reduce all returns. The study does not address portfolio turnover, driven by frequent 10-K issuance across firms. Shorting may not always be feasible as specified due to lack of shares to borrow.
- As shown in the second chart above, irregularities in alphas across deciles undermine confidence in findings.
- Portfolio construction and maintenance as described are beyond the reach of most investors, who would bear fees for delegating this work to a fund manager.