Do most stocks worldwide beat the risk-free rate of return? In their July 2019 paper entitled “Do Global Stocks Outperform US Treasury Bills?”, Hendrik Bessembinder, Te-Feng Chen, Goeun Choi and John Wei compare returns of individual global common stocks to that of 1-month U.S. Treasury bills (T-bills). They screen stock price data for obvious errors and filter/correct accordingly. For delisted stocks with no delisting return available, they set the final return to -30%. Using monthly returns with reinvested dividends in U.S. dollars for 17,505 U.S. and 44,476 non-U.S. stocks across 41 other countries (25 developed and 16 emerging) and monthly T-bill yield during 1990 through 2018, they find that:
- Most stocks underperform T-bills over matched time horizons. For example, over the full sample period:
- 56.3% of U.S. stocks and 60.7% of non-U.S. stocks underperform T-bills.
- Among non-U.S. stocks, 60.0% (62.4%) of developed (emerging) market stocks underperform T-bills.
- Across countries, percentages of stocks beating T-bills range from 22.8% in Greece and 33.2% in Australia to 65.6% in Switzerland and 67.7% in Columbia. More than half of stocks beat T-bills in only seven of 42 countries.
- However, average stock returns:
- Are positive in all 42 countries over the full sample period.
- Are 0.96%, 14.1%, 95.6% and 260% measured monthly, annually, by decade and over the full sample period, respectively, each greatly exceeding T-bill bill return at matched horizons.
- Over the full sample period, the entire sample of stocks generates $44.7 trillion in shareholder wealth in excess of T-bill return.
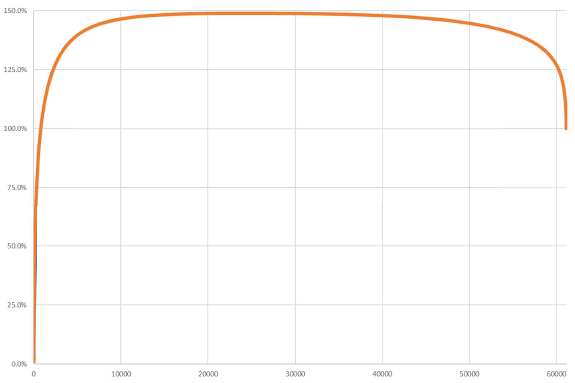
- Regarding full-sample concentration of wealth creation (see the chart below):
- The five stocks with the largest full-sample returns (Apple, Microsoft, Amazon, Alphabet and Exxon Mobile) account for 8.3% of global wealth creation.
- The top 306 stocks (0.5%) account for 73% of global wealth creation.
- The top 811 firms (1.3%) account for 100% of global wealth creation.
- Regarding non-U.S. concentration of wealth creation, the top 221 non-U.S. stocks account for 94% of non-U.S. wealth creation.
- In general, higher stock return volatility is associated with a lower percentage of stocks beating T-bills and greater concentration of wealth creation.
- Accounting for amounts and timing of cash flows (dividends, share buybacks and new equity issuance) amplifies the finding that most global common stocks underperform T-bills in the long run.
- Results highlight:
- Practical implications of strong positive skewness of the distribution of long-run stock returns.
- The degree to which successful stock picking, if possible, could enhance individual wealth.
The following chart, adapted from one in the paper, tracks cumulative percentage contribution to excess wealth creation from adding firms ranked from highest to lowest wealth creation for the entire sample over the full sample period. Excess wealth creation for each stock is end-of-sample value of actual investments in the stock in U.S. dollars minus value that would have been generated by instead buying T-bills. The wealth creation curve ends at 100% by construction. It reaches a maximum of 148.8% with addition of the last of 23,095 stocks with positive excess wealth creation. All stocks subsequently added destroy excess wealth.

In summary, evidence indicates that most global stocks generate negative long-term excess returns and that long-term equity wealth creation concentrates among a relatively few stocks.
In other words, to assure beating the risk-free rate, investors who cannot pick winner stocks should diversify to ensure they hold some big winners.
Cautions regarding findings include:
- Maintaining a diversified global stock portfolio involves costs not considered in the study.
- At times during the sample period, the T-bill yield is below the inflation rate, such that wealth creation as specified does not always equal increase in purchasing power.
See also the closely related “T-bills Beat Most Stocks?”, analyzing U.S. stocks over a longer sample period.