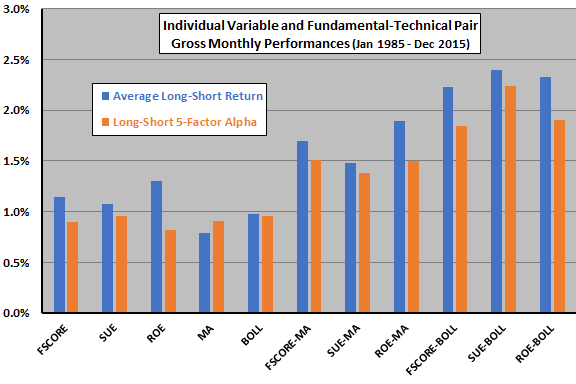
What kinds of fundamental and technical indicators play well together? In their August 2018 paper entitled “When Buffett Meets Bollinger: An Integrated Approach to Fundamental and Technical Analysis”, Zhaobo Zhu and Licheng Sun test performance of six stock portfolios that jointly exploit one of three popular fundamental indicators and one of two popular technical indicators, as follows:
- Piotroski’s FSCORE – each quarter long (short) stocks having high (low) scores summarizing a composite of accounting variables.
- Standardized unexpected earnings (SUE) – each quarter long (short) the fifth of stocks with the highest (lowest) earnings surprises.
- Return on equity (ROE) – each quarter long (short) the fifth of stocks with the highest (lowest) ROEs.
- Moving averages (MA) – each month long (short) stocks with 20-day MAs above (below) 125-day MAs at the end of the prior month.
- Bollinger bands (BOLL) – long (short) stocks below (above) one standard deviation of daily prices below (above) the average prices over the past 20 trading days.
Specifically, for each of six fundamental-technical pairs, they each month reform a portfolio that is long (short) stocks with both fundamental and technical buy (sell) signals. For risk adjustment, they employ widely used 5-factor (market, size, book-to-market, profitability, investment) alpha. Using accounting data and stock returns for a broad sample of U.S. common stocks priced at least $5, plus monthly factor returns, during January 1985 through December 2015, they find that:
- For the five individual indicator equal-weighted long-short portfolios (see the chart below):
- Average monthly gross return is 1.06%, ranging from 0.79% for MA to 1.30% for ROE. Monthly gross Sharpe ratios range from 0.08 for MA to 0.60 for SUE.
- Average gross 5-factor alpha is 0.91%, ranging from 0.82% for ROE to 0.96% for SUE and BOLL.
- For the six fundamental-technical pair equal-weighted long-short portfolios (again, see the chart below):
- Average monthly gross return is 2.01%, ranging from 1.48% for SUE-MA to 2.33% for ROE-BOLL. Monthly gross Sharpe ratios range from 0.42 for ROE-MA to 0.71 for SUE-BOLL.
- Average gross 5-factor alpha is 1.73%, ranging from 1.38% for SUE-MA to 2.24% for SUE-BOLL.
- Average monthly gross return and average gross 5-factor alpha for the three x-MA (x-BOLL) portfolios are are 1.69% and 1.46% (2.32% and 1.99%), respectively. In other words, reversal works better than trend following in combination with fundamentals.
- Outperformance of combination portfolios concentrates among stocks with high idiosyncratic volatility.
- x-MA portfolios are stronger when the overall stock market rises, whereas x-BOLL portfolios are stronger when the market falls.
- Use of value-weighted portfolios reduces average monthly gross returns by 70% (50%) for x-MA (x-BOLL) combination portfolios.
- Findings are generally robust to substituting a 200-day long MA and two standard deviation bandwidth for BOLL.
The following chart, constructed from findings in the paper, summarizes average monthly gross returns and gross monthly 5-factors alphas for long-short stock portfolio based on the five individual fundamental and technical indicators and for the six fundamental-technical indicator pairs.

In summary, evidence indicates that combining stock fundamentals with reversal technical indicators may materially enhance investment performance.
Cautions regarding findings include:
- As noted, findings are gross, not net. Quarterly/monthly portfolio rebalance frictions would reduce returns, as would continuous costs of shorting. Shorting may not be feasible for all stocks as specified due to lack of shares to borrow. Moreover:
- Different variables drive different portfolio turnovers, such that relative net performance of portfolios may differ from relative gross performance.
- Focus on equal weighting for portfolios exacerbates costs via large positions in small stocks, as demonstrated by the much degraded performance of value-weighted portfolios.
- Concentration of the effect among stocks with high idiosyncratic volatility (costly to trade and short) also exacerbates costs.
- Monthly data acquisition/processing costs may also be material, particularly for investors who delegate these tasks to a fund manager.
- Testing multiple indicators/combinations on the same sample introduces data snooping bias, such that the best-performing combinations overstate expectations. Moreover, selection of predictive variables based on prior research may inherit snooping bias from prior studies.
See also “Combining Annual Fundamental and Monthly Trend Screens” and “Technical Boost to Fundamental Stock Market Forecasting?”.