In response to “Robustness of SACEMS Based on Sharpe Ratio”, a subscriber asked whether Martin ratio might work better than raw returns and Sharpe ratio for ranking assets within the Simple Asset Class ETF Momentum Strategy (SACEMS), which each month selects the best performers over a specified lookback interval from among the following eight asset class exchange-traded funds (ETF), plus cash:
PowerShares DB Commodity Index Tracking (DBC)
iShares MSCI Emerging Markets Index (EEM)
iShares MSCI EAFE Index (EFA)
SPDR Gold Shares (GLD)
iShares Russell 2000 Index (IWM)
SPDR S&P 500 (SPY)
iShares Barclays 20+ Year Treasury Bond (TLT)
Vanguard REIT ETF (VNQ)
3-month Treasury bills (Cash)
To investigate, we focus on the SACEMS equally weighted (EW) Top 3 portfolio and compare outcomes across lookback intervals ranging from one to 12 months for the following three asset ranking metrics:
- Raw return – cumulative total return over the lookback interval.
- Sharpe ratio (SR) – average daily excess return (asset return minus T-bill return) divided by standard deviation of daily excess returns over the lookback interval, with months approximated as 21 trading days. We set SR for Cash at zero (though it is actually zero divided by zero).
- Martin ratio (MR) – average daily excess return divided by the Ulcer Index calculated from daily returns over the lookback interval, with months again approximated as 21 trading days.
We employ gross compound annual growth rates (CAGR) and maximum drawdowns (MaxDD) to compare ranking metrics. Using monthly dividend-adjusted closing prices for asset class proxies and the yield for Cash during February 2006 (when all ETFs are first available) through December 2018, we find that:
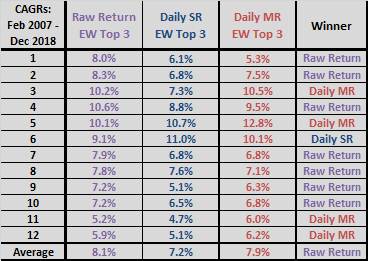
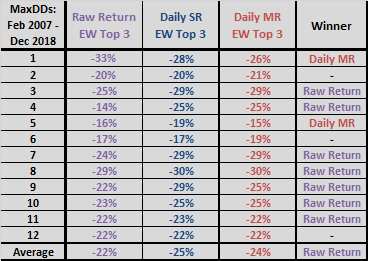
The following two tables compare gross CAGRs and MaxDDs for SACEMS EW Top 3 based on raw return, SR and MR across lookback intervals ranging from one to 12 months. First monthly returns are for March 2007 to accommodate the longest lookback interval of 12 months.
Regarding CAGRs:
- MR for a 5-month lookback stands out, but MR wins only four of 12 lookback intervals. Based on unevenness of performance, MR for a 5-month lookback interval appears to be lucky.
- Raw return wins seven of 12 lookback intervals and the overall average.
- In a sweet spot of lookback intervals (3-month to 6-month, which is favorable to MR compared to any wider range), average CAGR is 10.7% for MR versus 10.0% for raw return.
Regarding MaxDDs:
- MR for a 5-month lookback again stands out, but MR wins or ties only three of 12 lookback intervals.
- Raw return wins or ties 10 of 12 lookback intervals.
- In the above CAGR sweet spot of lookback intervals (3-month to 6-month), raw return wins or ties three of four. MR wins or ties one.
As when experimenting with lookback intervals, experimenting with different ranking metrics on the same dataset introduces data snooping bias. The more metrics tried, the greater the chance that a metric-lookback interval combination will have very lucky performance.


In summary, evidence from available data offers some support for belief that Martin ratio is better than raw return for monthly generation of the SACEMS EW Top 3 portfolio.
Cautions regarding findings include:
- Sample size is modest (about 13 independent 12-month lookback intervals), especially in terms of variety of market conditions.
- As noted, analyses are gross. Accounting for costs of monthly portfolio reformation would reduce returns. However, turnovers are similar for the competing metrics.
- As noted, testing multiple lookback intervals and different ranking metrics introduces data snooping bias, such that the best-performing combinations overstate expectations. Bias increases with the number of metrics tested.
- Calculating Sharpe ratio and Martin ratio with daily data is more complicated and time consuming than calculating raw cumulative returns.