A betting against beta (BAB) portfolio is long low-beta assets and short high-beta assets, with each side leveraged to a beta of one. Do strong past stock market returns (when investors tend to overweight high-beta stocks) predict an increase in BAB returns? In his June 2018 paper entitled “Time-Varying Leverage Demand and Predictability of Betting-Against-Beta”, Esben Hedegaard tests the prediction that BAB performs better in times and in countries after high past stock market returns in three ways: (1) regression of BAB returns versus past market returns; (2) sorts of BAB returns into fifths (quintiles) based on past market returns; and, (3) a timing strategy that is long BAB half the time and short BAB half the time based on detrended inception-to-date past market returns, scaled to 10% annualized volatility for comparability. Using daily and monthly data, including monthly BAB returns, for U.S. common stocks and the U.S. stock market since 1931 and for 23 other countries from as early as 1988, all through January 2018, he finds that:
- BAB returns have a positive (strongly negative) correlation with past (same-period) stock market returns. For the U.S. sample, a monthly market return one standard deviation above the norm predicts 0.64% gross abnormal return next month for a BAB strategy with 10% annualized volatility (0.77 boost in annualized gross Sharpe ratio for the BAB strategy).
- Sorting BAB returns into quintiles based on 1-month, 6-month or 12-month past stock market returns confirms that gross BAB returns are higher following high past market returns. For the U.S. sample, average monthly gross BAB returns after the lowest (highest) quintile of 1-month past market returns is -0.43% (1.64%). Results are qualitatively similar for past 6-month and 12-months past market returns. Conventional size, value and momentum factors do not explain the effect.
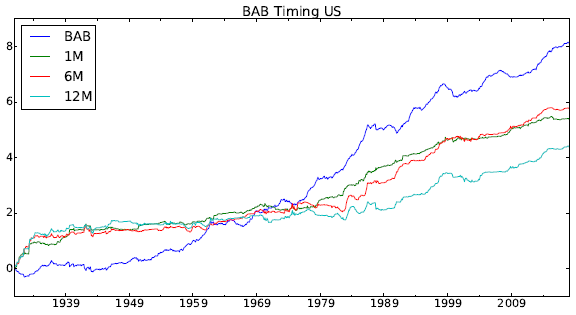
- The BAB timing strategy generally beats the market (see the chart below for the U.S.). The version based on 12-month past market returns generates positive 2-factor (market and BAB itself) gross alphas for 22 of 24 countries, significantly so in 12 countries. In aggregate, a capitalization-weighted global BAB timing strategy generates 2-factor monthly gross alpha:
- 0.91% based on 12-month past returns.
- 1.30% based on 6-month past returns.
- 1.09% based on 1-month past returns.
- Past stock market returns help explain country differences in future BAB returns. Future BAB returns are higher (lower) in countries for which the past market return is higher (lower) than the cross-country average market return.
- Results are similar whether using U.S. dollars or local currencies.
The following chart, taken from the paper, plots cumulative logarithm of returns during February 1931 to February 2018 for the U.S. BAB factor and for three BAB timing strategies based on 1-month, 6-month and 12-month past market returns, all scaled to ex-ante 10% volatility for comparability. Gross annualized Sharpe ratio for BAB is 0.99, while those for the three BAB timing strategies are 0.67, 0.71, and 0.55, respectively. In other words, the BAB timing strategies beat the overall stock market, but mostly underperform the BAB factor.
Results for market capitalization-weighted global strategies during January 1989 to February 2018 are similar, but stronger.

In summary, evidence indicates that investors may be able to improve betting-against-beta stock strategy performance by accounting for the positive (negative) effect of strong (weak) overall recent stock market returns.
Cautions regarding findings include:
- Returns/alphas are gross, not net. Accounting for monthly portfolio reformation, shorting and leverage costs would reduce returns and may affect findings. Shorting may not always be feasible as modeled.
- BAB and BAB timing portfolio maintenance is beyond the reach of most investors, who would bear fees for delegating to a fund manager.
- Regression and sorting tests are in-sample, such that an investor operating in real time may not be able to exploit findings.
- The BAB timing strategy selected for testing underperforms the basic BAB strategy. It is ineffective in boosting BAB performance by exploiting BAB return predictability.