Do informed (noise) traders drive short-term stock return momentum (reversal)? In their April 2018 paper entitled “Short-term Momentum”, Mamdouh Medhat and Maik Schmeling investigate interaction of short-term momentum/reversal and recent share turnover for U.S. and international stocks. They define share turnover as prior-month trading volume divided by number of shares outstanding. Specifically, they consider four portfolios:
- Conventional short-term reversal: Each month go long (short) the value-weighted tenth, or decile, of stocks with the lowest (highest) prior-month returns.
- Conventional momentum: Each month go long (short) the value-weighted decile of stocks with the highest (lowest) returns from 12 months ago to one month ago.
- Modified short-term reversal (short-term reversal*): Each month go long (short) the value-weighted decile of stocks with the lowest (lowest) share turnovers within in the presorted decile of stocks with the lowest (highest) prior-month returns. [Long and short sides are reversed from those in the paper so that the expected portfolio return is positive.]
- Short-term momentum: Each month go long (short) the value-weighted decile of stocks with the highest (highest) share turnovers within in the presorted decile of stocks with the highest (lowest) prior-month returns.
In other words, they pick stocks for portfolios 3 and 4 by first sorting into deciles based on prior-month return and then sorting each of these deciles into nested deciles sorted based on share turnover. Using data for a broad sample of U.S. common stocks since July 1962 and common stocks in 22 developed markets since January 1993, both through December 2016, they find that:
- Based on double-sorting of U.S. stocks (see the chart below):
- On average, low-turnover stocks exhibit strong short-term reversal, driven by noise trading. The short-term reversal* portfolio specified above generates average monthly gross excess return 1.41%, compared to 0.35% for conventional short-term reversal. The effect is stronger among small stocks than large stocks.
- On average, high-turnover stocks exhibit short-term momentum, driven by informed trading. The short-term momentum portfolio specified above generates average annualized gross excess return 1.31%, about the same as conventional momentum. Also similar to conventional momentum, outperformance persists about 12 months after portfolio formation.
- Standard risk factors, including conventional short-term reversal and conventional momentum, do not explain short-term reversal* or short-term momentum.
- Purging noise trades from prior-month returns and turnovers by excluding the last three trading days of the month: (1) raises average monthly gross excess return for short-term momentum from 1.31% to 1.74%; and, (2) lowers this metric for short-term reversal* from 1.41% to 0.21%.
- Focusing on noise trades from prior-month returns and turnover by using only the last three trading days of the month: (1) raises average monthly gross excess return for short-term reversal* from 1.41% to 2.41%; and, (2) lowers this metric for short-term momentum from 1.31% to -0.95%.
- For the shorter international developed market sample, combined by weighting country markets based on respective total market capitalizations:
- The short-term reversal* portfolio specified above generates average monthly gross excess return 3.01%, compared to 0.23% for conventional short-term reversal.
- The short-term momentum portfolio specified above generates average annualized gross excess return 1.45%.
- Results from purging or focusing on noise trades are similar to those for the U.S. sample.
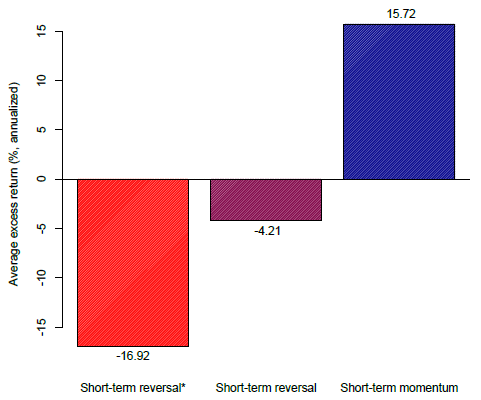
The following chart, taken from the paper, summarizes average annualized gross excess returns for the two short-term reversal portfolios (3 and 1) and the short-term momentum portfolio (4) as specified above and applied to U.S. stocks over the full sample period.
Results indicate that using prior-month share turnover to separate stocks with mostly noise or informed trading considerably affects short-term reversal/momentum.

In summary, evidence indicates that low or high recent share turnover strongly distinguishes between stocks expected to exhibit short-term reversal or short-term momentum.
Cautions regarding findings include:
- Reported results are gross, not net. Monthly portfolio rebalancing frictions and shorting costs would reduce all returns. Since the short-term reversal* effect concentrates among small and low-turnover stocks, frictions may be very high. Moreover, shorting may not be feasible for all stocks as specified due to lack of shares to borrow. The corresponding author states that a near-term update of the paper will address trading frictions.
- The double-sorting approach described is beyond the reach of many investors, who would bear fees for delegating to a fund manager.
- Average returns do not vary monotonically across deciles, undermining confidence in reliability of findings. In other words, the extreme deciles do not consistently have the extreme returns.
- Cumulative tests (lower chart in Figure 3 of the paper) suggest short-term momentum does not work from the mid-1970s through the 1980s, and short-term reversal* does not work since the mid-2000s, even on a gross basis. Also, short-term momentum has a severe drawdown during the 1970s. These findings emphasize that average sample returns are not sufficient to evaluate portfolio performance.