Do investors underestimate the adverse import of large left tails for future stock returns? In their November 2017 paper entitled “Left-Tail Momentum: Limited Attention of Individual Investors and Expected Equity Returns”, Yigit Atilgan, Turan Bali, Ozgur Demirtas and Doruk Gunaydin investigate the relationship between left-tail risk and next-month returns for U.S. and international stocks. They measure left-tail risk at the end of each month via either of:
- Value-at-risk (VaR) – daily return of a stock at the first (VAR1) or fifth (VAR5) percentile of its returns over the past one year (250 trading days).
- Expected shortfall – average daily return of a stock for the bottom 1% (ES1) or bottom 5% (ES5) of its returns over the past year (250 trading days).
They then sort stocks into tenths (deciles) based on left-tail risk and examine variation in next-month average gross returns across deciles. Using daily prices and monthly firm characteristics and risk factors for U.S. stocks with month-end prices at least $5 during January 1962 through December 2014, they find that:
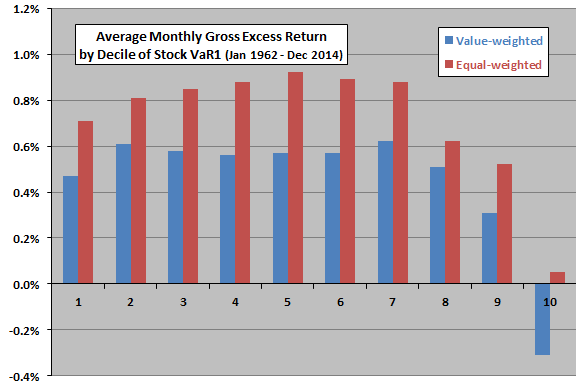
- U.S. stocks with high left-tail risks have unusually low average next-month gross return (see the chart below). Stocks in the highest value-weighted (equal-weighted) decile of left-tail risks have average next-month gross return -0.31% (0.05%).
- Stocks with high left-tail risk tend to have relatively high market betas, small market capitalizations, low book-to-market ratios, low momentum returns, low prior-month returns, low liquidity and high idiosyncratic volatility.
- The negative relationship between stock left-tail risk and future return lasts up to six months and is therefore robust to skipping a month between portfolio formation and holding interval.
- Findings are generally robust to: controlling for firm characteristics and risk factors; use of alternative measures of left-tail risk; and, alternative measures of left-tail risk.
- The left-tail risk anomaly is stronger during bad economic conditions.
- The left-tail risk anomaly is also stronger for stocks more likely to be held by individual investors than institutions, suggesting that individual investors underestimate persistence (momentum) of left-tail risk.
- Findings generally hold for a sample of international stocks priced in U.S. dollars, and subsamples of these stocks, during January 1988 through December 2014.
The following chart, constructed from data in the paper, compares average next-month gross excess returns across value-weighted and equal-weighted deciles of stock VaR1 for the full U.S. sample. Decile 1 (10) is that with the lowest (highest) left-tail risks. Results show that the negative relationship between left-tail risk and next-month return concentrates in the highest one or two deciles of left-tail risks.

In summary, evidence indicates that investors may want to avoid (or short) stocks with the highest left-tail risks measured over the past year.
Cautions regarding findings include:
- Results are gross, not net. Accounting for monthly portfolio reformation costs would reduce the magnitude of the discovered anomaly. Costs of shorting high-tail risk stocks may be prohibitive because of their characteristics. Shares of such stocks may not be available for shorting.
- Monthly calculations and portfolio maintenance are beyond the reach of most investors, who would bear fees for delegating these tasks to an investment manager.