Are there stock return forecasts good enough to make mean-variance optimization work as a stock portfolio allocation strategy? In their October 2017 paper entitled “Mean-Variance Optimization Using Forward-Looking Return Estimates”, Patrick Bielstein and Matthias Hanauer test whether firm implied cost of capital (ICC) based on analyst earnings forecasts is effective as a stock return forecast for mean-variance portfolio optimization. They derive ICC annually for each stock as the internal rate of return (discount rate) implied by a valuation model that equates forecasted cash flows, derived from analyst earnings forecasts, to market valuation. To refine ICC estimates, they correct predictable analyst forecast errors (slow reactions to news) by including a standardized, rescaled momentum variable based on return from 12 months ago to one month ago (ICCadj). They then employ ICCadj to specify annual (each June 30) mean-variance optimized (maximum Sharpe ratio) long-only stock allocations (with maximum weight 5%) based on stock return covariances calculated from returns over the last 60 months. For benchmarks, they consider the value-weighted market portfolio (VW), the equal-weighted market portfolio (EW), the minimum variance portfolio (MVP) and a maximum Sharpe ratio portfolio based on 5-year moving average actual returns (HIST). They focus on U.S. stocks, which have relatively broad analyst coverage. They test robustness of findings with data from selected international developed markets, different return variable specifications, different subperiods and impact of transaction costs. Using monthly data for the 1,000 U.S. common stocks with the biggest prior-month market capitalizations since June 1985 and the 250 biggest stocks in each of Europe, UK and Japan since 1990, all through June 2015, they find that:
- ICC is substantially lower, on average, than 5-year moving average return and nearly 10 times less volatile. ICC relates negatively to 5-year moving average return, negatively to momentum and positively to book-to-market ratio.
- The number of stocks in the maximum Sharpe ratio portfolio based on ICCadj (ICCadj) ranges from 23 to 57. MVP generally holds more stocks than ICCadj.
- ICCadj has annual one-way turnover 66%, compared to 4% for VW, 21% for EW, 48% for MVP and 67% for HIST.
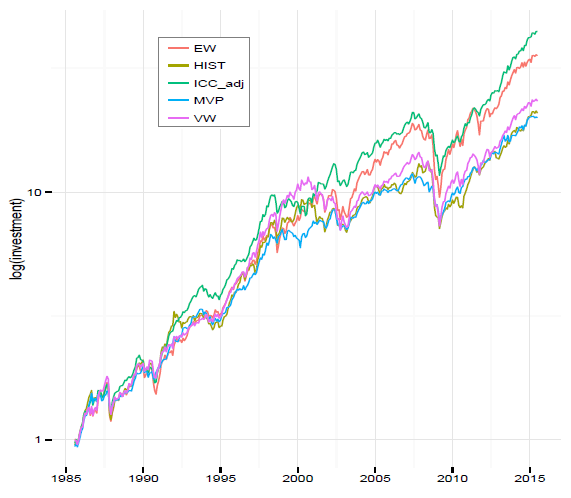
- ICCadj has gross compound annual growth rate (CAGR) 13.5%, gross annual Sharpe ratio 0.78 and worst 12-month return -36%, compared to (see the chart below):
- 11.1%, 0.55 and -42% for VW.
- 12.6%, 0.60 and -42% for EW.
- 10.5%, 0.65 and -29% for MVP.
- 10.7%, 0.53 and -41% for HIST.
- ICCadj outperforms VW in 63% of test period months, compared to 60% for EW, 43% for MVP and 50% for HIST.
- ICCadj strategy captures some of value and momentum premiums and achieves 2.6% gross annual 4-factor (market, size, book-to-market, momentum) alpha.
- Results generally hold for the selected international markets, for different methods for predicting stock returns from ICCadj, for different mean-variance optimization constraints, across subperiods and after accounting for portfolio rebalancing frictions. For example:
- ICCadj has the highest gross annualized Sharpe ratio in three of six 5-year subperiods.
- Conservatively assuming 0.5% one-way trading frictions, ICCadj has the highest net CAGR (12.8%) and net annualized Sharpe ratio (0.72), with EW most competitive at 12.4% and 0.59, respectively.
- However, unadjusted ICC does not work well as a stock return predictor.
The following chart, taken from the paper, compares gross cumulative values of $1 initial investments in each of EW, HIST, ICCadj, MVP and HIST portfolios as specified above over the test period, using monthly measurements. ICCadj outperforms all other strategies, followed by the more volatile EW. All strategies suffer substantial drawdowns during the 2008-2009 financial crisis.

In summary, evidence indicates that deriving expected returns from a combination of analyst earnings forecasts and return momentum may enable mean-variance optimization to outperform other portfolio construction methods.
However, the simplicity and competitiveness of EW is notable.
Cautions regarding findings include:
- The ICCadj optimization model is complex enough to accommodate snooping of multiple parameters, such that its performance overstates expectations.
- The methodology applies to individual stocks with sufficiently broad analyst coverage. It does not obviously extend to small stocks, equity indexes or other asset classes.
- Data requirements, calculations and portfolio management are beyond the reach of most investors, who would bear fees for delegating to expert advisors/fund managers.