Can investors confidently pick hedge funds that will do well? In their September 2017 paper entitled “Hedge Fund Performance Prediction”, Nicolas Bollen, Juha Joenväärä and Mikko Kauppila examine the forecasting power of 26 hedge fund performance predictors identified in past research. These predictors span five categories: seven broad manager skills; four market timing skills; six systematic risks; four tail risks; and, five incentive metrics. They test the predictors individually and in combinations based on an average of rankings by category and overall. Specifically, for their main tests, they each year:
- Sort funds into fifths (quintiles) based on one predictor or a combination of predictors as measured over the prior 24 months.
- Randomly select several funds (baseline 15) from the top quintile to represent a feasible long-only hedge fund portfolio.
- Hold the selected funds with initial equal weights but no interim rebalancing for one year.
- Calculate the performance of a succession of such one-year portfolios over the sample period.
They run 1,000 trials for each predictor/combination to obtain a performance distribution. Their benchmark is an 80% allocation to the S&P 500 Total Return Index and a 20% allocation to the Vanguard Total Bond Market Index mutual fund (VBTIX), rebalanced annually. They collect data starting in January 1994 but delete the first 12 months to control for backfill bias (reporting of a successful year after the fact). As a robustness test, they repeat the analysis on two subperiods with break point at the end of February 2009. Using monthly returns after fees and characteristics for a broad sample of hedge funds during January 1995 through December 2016, they find that:
- Over the full sample period:
- The average hedge fund has lower average annual return than the benchmark (3.7% versus 7.9%).
- However, because hedge funds are generally less volatile than the benchmark, average hedge fund annual Sharpe ratio is close to that of the benchmark (0.45 versus 0.48).
- Hedge fund Sharpe ratios are widely dispersed (-0.14 and at the 25th percentile and 0.67 at the 75th).
- Subperiod performances vary widely. Average hedge fund Sharpe ratio is:
- 0.74, compared to 0.40 for the benchmark, during January 1997-December 2007.
- -0.74, compared to -2.54 for the benchmark, during January 2008-February 2009.
- 0.64, compared to 1.40 for the benchmark, during March 2009-December 2016.
- Over the full sample period, using complete top-minus-bottom equally weighted quintile portfolios:
- At a 1-month (12-month) forecast horizon, eight (three) of 26 individual predictors significantly predict fund returns.
- For the combination of all 26 predictors, annualized Sharpe ratio at a 1-month (12-month) forecast horizon is 1.19 (0.60).
- For 1,000 trials of equally weighted portfolios consisting of 15 funds randomly selected from top predictor quintiles, with a 12-month holding interval:
- Over the full sample period:
- Hedge fund portfolio average annual returns are mostly not significantly different from that of the benchmark (8.0%).
- Hedge fund portfolio average annual volatilities are almost uniformly much lower than that of benchmark (12.1%).
- Combining skill category predictors or incentive category predictors generates the best average hedge fund portfolio performance.
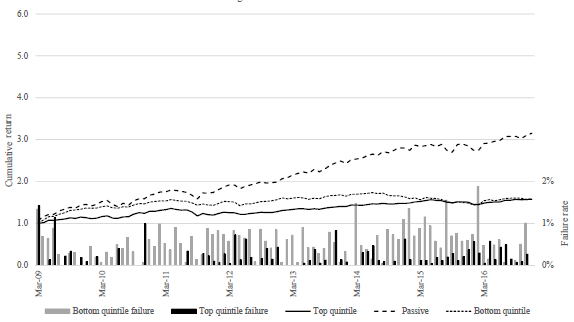
- As above, hedge fund outperformance concentrates during January 1997 through February 2009 (see the chart below).
- For the combination of all 26 predictors, hedge fund portfolio average annual Sharpe Ratio is 0.76 higher (0.71 lower) than that of the benchmark before (after) the end of February 2009.
- Since February 2009, hedge fund portfolio average annual returns are significantly lower than that of the benchmark for 22 of 26 individual predictors.
- Over the full sample period:
- Randomly selecting five (30) funds from top predictor quintile has little effect on hedge fund portfolio average return compared to 15 funds, but increases (decreases) portfolio average volatilities and hence lowers (raises) average Sharpe ratios.
The following chart, taken from the paper, compares cumulative returns during March 2009 through December 2016 for three portfolios:
- The average of 1,000 equally weighted and annually reformed portfolios of 15 hedge funds randomly selected from the top quintile of hedge funds based on a combination of all 26 hedge fund performance predictors.
- The average of 1,000 equally weighted and annually reformed portfolios of 15 hedge funds randomly selected from the bottom quintile of hedge funds based on a combination of all 26 hedge fund performance predictors.
- The benchmark annually rebalanced 80% allocation to the S&P 500 total return index and 20% allocation to VBTIX.
The chart also shows on the right axis average failure rates of hedge funds that are each month in the top and bottom quintiles.
Results indicate that, since February 2009, hedge funds with the highest expected returns have: (1) badly underperformed the benchmark; and, (2) not outperformed those with the lowest expected returns.

In summary, evidence indicates that hedge fund return predictors (and perhaps hedge funds themselves) have not worked since the 2008-2009 financial crisis.
Cautions regarding findings include:
- The subsample break point at the end of February 2009 is, of course, selected retrospectively for extreme effect.
- Examples featuring the best-performing hedge fund predictors ignore the snooping bias accrued by testing many predictors, thereby overstating expectations.
- The prediction methodology, especially for combinations of predictors, is complex, such that an investors would likely need an advisor (and pay fees) to identify hedge funds with relatively strong expected performance.
- Holding an annually reformed portfolio of even as few as five hedge funds may be problematic/infeasible for many investors.