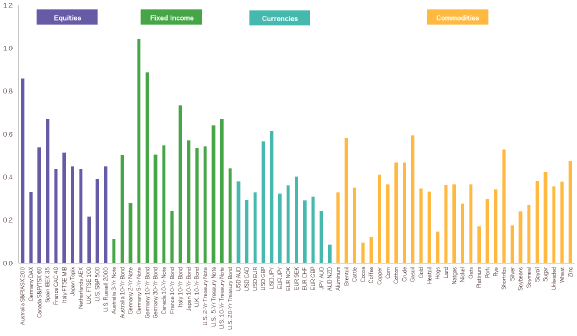
Does time series (intrinsic or absolute) return momentum work everywhere all the time? In their June 2017 paper entitled “A Century of Evidence on Trend-Following Investing”, Brian Hurst, Yao Ooi and Lasse Pedersen investigate the robustness of intrinsic momentum across 67 assets over 137 years. Robustness tests address subperiods, market return/volatility states and economic conditions. They rely mostly on futures prices series but use cash index returns financed at local short-term interest rates when futures data is not available. They consider lookback intervals of one, three and 12 months for momentum measurement. Specifically, they each month:
- Measure for each asset 1-month, 3-month and 12-month past excess returns (relative to the risk-free rate).
- For each lookback interval, take a long (short) position for each asset with a positive (negative) past excess return, scaled to target equal volatility.
- Combine positions across the three lookback intervals and scale the aggregate portfolio to 10% expected annualized volatility (based on rolling 3-year historical windows) for comparability over time.
- Subtract portfolio reformation frictions (based on current and historical estimates) and fees (2% annually plus 20% performance fee above a high-water mark).
Using monthly returns for 67 assets from four classes (29 commodities, 11 equity indexes, 15 bond indexes and 12 currency pairs), along with equity market and economic data used in robustness tests, as available during 1880 through 2016, they find that:
- Over the full sample period, intrinsic momentum generates positive gross Sharpe ratios, ranging from less than 0.1 to over 1.0, across all 67 assets (see the chart below). Overall average net Sharpe ratio is 0.4, with no single asset class dominating performance.
- The aggregated intrinsic momentum portfolio generates positive net returns in each decade since 1880, with low correlations to traditional asset class returns. Moreover:
- Returns for the separate 1-month, 3-month and 12-month lookback interval portfolios are also positive in each decade.
- Inserting a skip-month between lookback interval and portfolio reformation results in positive returns in most decades but degrades performance, especially for the shorter lookback intervals.
- Intrinsic momentum tends to perform best during both extreme up and extreme down years for the U.S. stock market. Specifically, intrinsic momentum performs:
- Well during eight of the 10 worst 60-40 stocks-bonds portfolio drawdowns during the sample period.
- Marginally better during bear U.S. equity markets (peak-to-trough drawdowns greater than 20%) than the rest of the time.
- Consistently across times of increasing and decreasing U.S. stock market volatility.
- Intrinsic momentum performs well across:
- NBER economic expansion and contraction months.
- Wartime (World War 1, World War 2, Vietnam War, and Korean War) and peacetime (all other times).
- Times of high and low interest rates.
- Times of high and low inflation.
The following chart, taken from the paper, summarizes intrinsic momentum gross Sharpe Ratios for each of the 67 assets studied over the full 1880-2016 sample period. Gross Sharpe ratios are positive in all markets, with average 0.4.

In summary, evidence indicates intrinsic momentum performs well for many assets over the long run, supporting belief in persistent underlying behavioral drivers of trends.
Cautions regarding findings include:
- As noted in the paper, estimates of portfolio reformation frictions are uncertain, and the estimates do not account for costs of rolling futures contracts.
- Also as noted in the paper, some robustness tests (such as dating of economic contractions and inflation regimes) are retrospective and thus not exploitable.
- Investors may have been unable to collect/process the data required to exploit intrinsic momentum in a timely manner over much of the sample period. In others words, feedback from momentum trading that could affect market behavior may be missing in older data.
See also: