How accurate are consensus firm earnings forecasts worldwide at a 12-month horizon? In his May 2016 paper entitled “An Empirical Study of Financial Analysts Earnings Forecast Accuracy”, Andrew Stotz measures accuracy of consensus 12-month earnings forecasts by financial analysts for the companies they cover around the world. He defines consensus as the average for analysts coverings a specific stock. He prepares data by starting with all stocks listed in all equity markets and sequentially discarding:
- Stocks with market capitalizations less than $50 million (U.S. dollars) as of December 2014 or the last day traded before delisting during the sample period.
- Stocks with no analyst coverage.
- Stocks without at least one target price and recommendation.
- The 2.1% of stocks with extremely small earnings, which may results in extremely large percentage errors.
- All observations of errors outside ±500% as outliers.
- Stocks without at least three analysts, one target price and one recommendation.
He focuses on scaled forecast error (SFE), 12-month consensus forecasted earnings minus actual earnings, divided by absolute value of actual earnings, as the key accuracy metric. Using monthly analyst earnings forecasts and subsequent actual earnings for all listed firms around the world during January 2003 through December 2014, he finds that:
- The data screening process results in a sample of 7,434 firms across 70 countries, with 66.9% (33.1%) in developed (emerging) markets.
- The top three countries are the U.S., China and Japan, with 1,978, 698 and 597 firms, respectively, comprising 44% of sampled firms.
- The top three industries are Industrial, Consumer Discretionary and Financial, comprising about half of sampled firms.
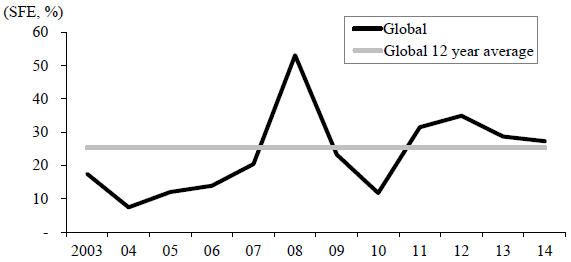
- For the full sample, consensus 12-month earnings forecasts are on average 25.3% too high as measured by SFE.
- Accuracy varies considerably by year, ranging from an average 7.4% too high during 2004 to 53.1% too high during 2008 (see the chart below).
- The distribution of accuracies is positively skewed, with median SFE only 3.3%.
- Average and median SFEs in developed (emerging) markets are 22.3% and 1.8% (35.0% and 9.8%).
- Average and median SFEs in the U.S. (developed markets excluding the U.S.) are 16.6% and 0.0% (25.6% and 3.2%).
- Average SFEs for cyclical sectors such as Materials and Energy are at least double those of non-cyclical sectors such as Health Care, Telecommunications and Utilities.
- Nearly all forecast error comes from stocks with declining actual earnings.
- Average SFE for a stock tends to decline as the number of analysts covering the stock increases up to 30 analysts, above which accuracy tends to worsen.
The following chart, taken from the paper, tracks consensus 12-month earnings forecast error (average SFE) by year during the sample period. The light gray flat line indicates the full sample average SFE of 25.3%. It appears that forecasts may be least accurate during economic recession (when actual earnings of many stocks fall) and most accurate during early economic expansion.

In summary, evidence indicates that relatively infrequent grossly optimistic earnings forecasts for firms with declining actual earnings drives a large average consensus 12-month earnings forecast error.
Cautions regarding findings include:
- The high skewness of the distribution of forecast errors may confound exploitability of findings. Median forecasts appear to be reasonably accurate, especially for U.S. stocks. There are relative few stocks with highly optimistic forecasts.
- The unusual global equity bear market of 2008 contributes substantially to average forecast error for the full sample. This economic effect may confound exploitation of the finding that nearly all forecast error comes from stocks with declining actual earnings. In other words, finding stocks with highly optimistic earnings forecasts may be similar to predicting bear markets.
For another perspective, see “FactSet S&P 500 Earnings Growth Estimate Evolutions”.