Are overnight option returns consistently different from intraday returns? In their July 2016 paper entitled “Why Do Option Returns Change Sign from Day to Night?”, Dmitriy Muravyev and Xuechuan Ni decompose the negative risk premium of S&P 500 Index options into intraday (open-to-close) and overnight (close-to-open) components. They apply delta hedging to distinguish the options premium from movement in the underlying asset. For robustness tests, they also consider return decompositions for options on individual stocks and exchange-traded funds (ETF) and S&P 500 Implied Volatility Index (VIX) futures. Using intraday bid and ask prices for options and underlying assets during January 2004 through April 2013, they find that:
- Overnight returns drive the overall negative premium (-0.7%) of delta-hedged S&P 500 Index options.
- The average overnight (intraday) return is -1.0% (+0.3%).
- The positive intraday return concentrates on average during the afternoon, especially near the close.
- Excluding weekends makes average overnight return slightly less negative (-0.8% versus -1.0%).
- Overnight and intraday option return volatility is about the same (4.5%) and tail returns are similar, so risk does not explain the average return difference.
- Average overnight return is negative during every year of the sample, ranging from -0.8% in 2008 to -1.7% in 2013. Average intraday return is mostly positive by year but varies considerably from -0.2% in 2012 to 1.6% in 2008, and average intraday morning return flips from negative to positive from the first half of the sample period to the second half.
- The overnight/intraday average return dichotomy is larger for high-leverage options (out-of-the-money and short-term).
- Average overnight (intraday) return is -1.7% (+.03%) for out-of-the-money options but -0.2% (+0.07%) for in-the-money.
- Average overnight (intraday) return is -2.6% (+.07%) for options with less than three weeks to expiration, but near zero (zero) for long-term options.
- Results are about the same for call and put options.
- Average overnight return is slightly more negative when VIX is high, interest rates are low and investor sentiment is low. Average intraday return is extremely positive when VIX is high (1.0%) or option liquidity is low (0.6%).
- The overnight/intraday dichotomy holds across options on major U.S. stock indexes, industry indexes, individual U.S. stocks and many ETFs, and for VIX futures.
- The average overnight (intraday) return for delta-hedged options on individual stocks is -0.4% (+0.1%). Stocks with larger overnight/intraday volatility differences have more pronounced option return asymmetries.
- However, for international equity ETFs, both overnight and intraday average option returns are negative and comparable in magnitude. For some country ETFs, such as China, average overnight return is positive, perhaps because news flow is opposite that of the U.S. market.
- Based on the same time delineations, average overnight (intraday) return for the most liquid VIX futures is -0.15% (+0.01%). All VIX futures with maturities up to six months have negative average overnight returns and slightly positive or zero average intraday returns.
- The overnight/intraday average option return dichotomy conflicts with the fact that equity volatility is substantially higher intraday than overnight. Option prices are too high at the close and too low at the open. It appears that option market makers do not lose money on this effect, and thus have little incentive to correct their models, because option traders are unaware of it.
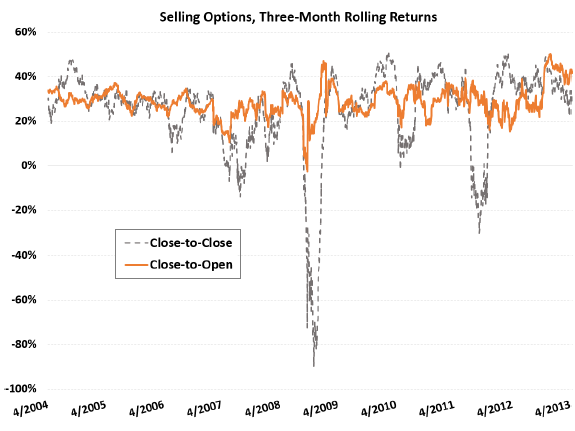
- While a trading strategy that each day sells a straddle or a delta-hedged call or put on the S&P 500 Index generates an average gross daily return of 0.7%, it loses 80% of capital during the financial crisis. However, executing the strategy only overnight increases average gross daily return to 1.0%, more than doubling gross Sharpe ratio and generating positive gross returns in every 3-month interval, including the financial crisis (see the chart below). However:
- High trading frictions (bid-ask spreads) for index options defeat the overnight strategy in practice.
- Applying the strategy to SPY options (average gross overnight return -0.64%) may be profitable on a net basis for sophisticated (algorithmic) traders who can substantially suppress the bid-ask spread by providing liquidity.
The following chart, taken from the paper, compares 3-month rolling gross returns for two trading strategies that each day sell delta-hedged S&P500 Index options:
- A conventional strategy that holds to expiration (Close-to-Close), with daily adjustment of delta hedges.
- A strategy that holds only overnight (Close-to-Open), opening and closing positions daily.
Specifically, the strategies sell calls and puts that trade at least once on a given day and hedges position deltas via index futures. Returns assume trade executions at bid-ask midpoints. Results show that the overnight strategy is much more stable than the conventional strategy, avoiding large drawdowns and thereby more than doubling gross Sharpe ratio. However, the overnight strategy incurs two trades for each option daily, thereby probably incurring trading frictions that swamp gross returns.

In summary, evidence indicates a large asymmetry between overnight and intraday gross delta-hedged option returns in the U.S. equity market, in conflict with lower overnight equity volatility. However, high option trading frictions preclude exploitation for most investors.
Investors trading options for other reasons may want to consider the implication that U.S. option prices are too high at the close and too low at the open.
Cautions regarding findings include:
- Most results are gross, not net. As noted in the paper, daily trading frictions (option bid-ask spreads) swamp average daily delta-hedge returns for overnight trading by most investors. The argument regarding profitability of overnight SPY option return capture appears to be a reach beyond grasp for practical relevance.
- Testing many different assets and variable dependencies introduces data snooping bias, such that the strongest reported returns overstate expectations.