“Central Bank Gold Reserves, Gold Lending and Gold Price” finds some conditional relationships between aggregate world central bank gold reserves and gold price. Can investors exploit these relationships? To check, we relate recent quarterly estimates of central bank gold reserves and quarterly spot gold price, noting that there is roughly a one quarter delay in availability of the former. Using these data from the end of the first quarter of 2000 through the end of the first quarter of 2016, we find that:
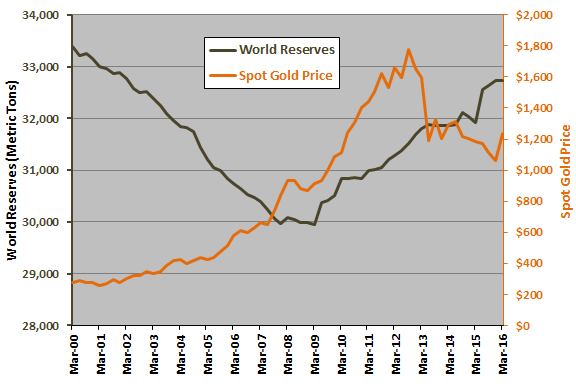
The following chart tracks aggregate world central bank gold reserves in metric tons (left axis) and spot gold price in dollars (right axis) over the available sample period. The relationship between the two series is inconsistent. During the first half of the sample period (through December 2007), the correlation between the two series is -0.95. During the second half, the correlation is +0.35. The regime shift in the middle of the sample period is perhaps related to disruption of the gold carry trade by very low interest rates. There may be another regime shift late in the sample period.
To investigate short-term dynamics of the relationship, we relate quarterly change in reserves to spot gold quarterly return.

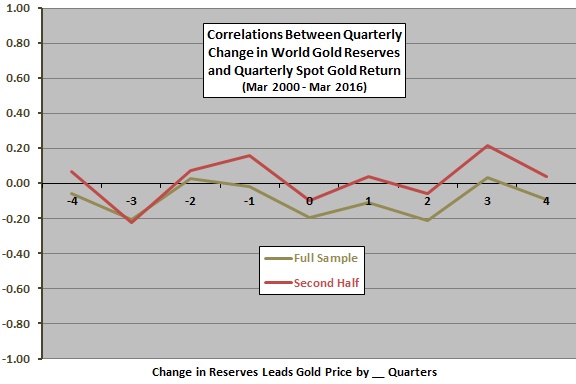
The next chart summarizes correlations for various lead-lag relationships between quarterly change in aggregate world central bank gold reserves and spot gold quarterly return over the full sample period and the second half of the sample period, ranging from gold return leads change in reserves by four quarters (-4) to change in reserves leads gold return by four quarters (4). Results appear to be mostly noise.
Since information about gold reserves has a one-quarter lag, the first potentially exploitable relationship is the negative correlation at “2.” For the full sample period, the negative correlation suggests that relatively strong purchases (sales) of gold by central banks this quarter points to relatively weak (strong) gold return two quarters hence. For the second half of the sample period, after the mid-sample regime change, the correlation at “2” is just slightly negative.
The available sample is very short for this kind of analysis, especially for the half sample period. Findings may be just noise.
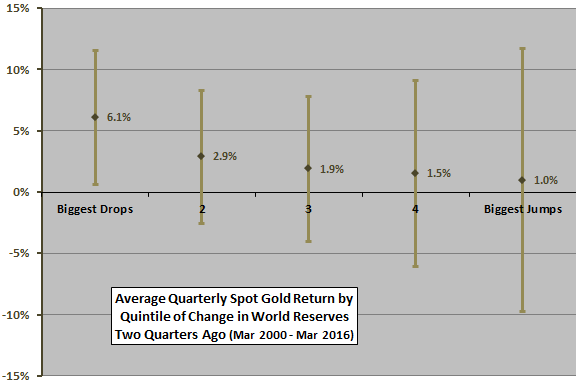
In case there is an important non-linearity in the relationship, we look at average spot gold return by ranked fifth (quintile) of change in reserves.

The final chart summarizes average spot gold returns and one standard deviation variability ranges across quintiles of change in aggregate world central bank gold reserves two quarters ago for the full sample period. Results suggest that spot gold returns are relatively strong (weak) and more (less) reliable when central banks were aggressively selling (buying) gold two quarters ago. However, there are only 12-13 observations per quintile, so indications are not very reliable. For example, excluding the single worst quarterly observation from the “Biggest Jumps” quintile raises average spot gold return from 1.0% to 3.4% and reduces standard deviation of quarterly returns from 10.7% to 7.1%.

In summary, evidence from recent data suggests that gold traders should at most view the most recently available quarterly change in aggregate world central bank gold reserves contrarily, but the relationship is not reliable.
Cautions regarding findings include:
- As noted, there appear to be two regimes in the sample, perhaps associated with the collapse of interest rates and gold carry trade profitability in 2008.
- As noted, sample duration is modest, especially for the half-sample lead-lag analysis and the quintile breakdown, so findings are not very reliable. Regime changes appear to be dramatic.
- Analyses are in-sample using all data. The sample is not long enough to support out-of-sample testing.