Can investors avoid strategy flame-outs associated with overly enthusiastic backtesting (overfitting)? In his July 2016 paper entitled “Limitations of Quantitative Claims About Trading Strategy Evaluation”, Michael Harris presents two examples that demonstrate a key limitation of trading strategy backtesting:
- U.S. stock market trend following.
- U.S. stock market mean reversion.
Specifically, he compares performances of such strategies before and after 1997 to illustrate the interaction of backtesting and change in market conditions. Using daily S&P 500 Index returns (excluding dividends) during January 1950 through December 2015, he finds that:
- “Trading strategy development will always remain an empirical field that is partly science but also partly art. Although the academic community has contributed significantly in raising awareness about certain issues, it cannot provide a framework for generating those ‘creative moments’…but only investigate whether a moment was not as creative as was expected.”
- The best antidote for overfitting/selection bias is restricting backtests to similar simple return predictors.
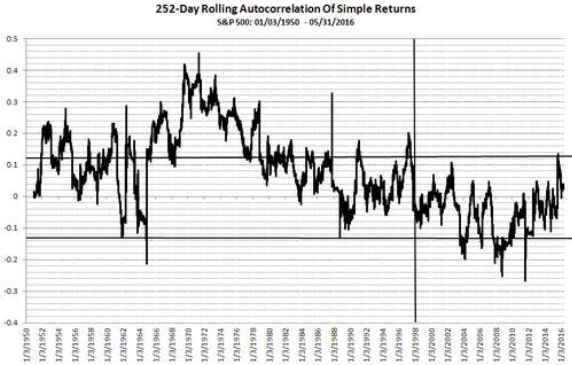
- Identifying changes in market conditions is often more important than performing quantitative strategy backtests. For example, the change from mostly positive to mostly negative rolling 252-day autocorrelation of S&P 500 daily returns in 1997 (see the chart below):
- Disrupts intermediate-term trend following strategies that used to work.
- Enables short-term mean reversion strategies that used to not work.
The following chart, taken from the paper, tracks the rolling 252-day autocorrelation of S&P 500 Index daily returns during 1950 through 2015. This measure of market conditions is mostly positive before the end of 1997 (denoted by a vertical line) and mostly negative thereafter. Horizontal lines represent a 95% confidence band that autocorrelation is not statistically different from zero based on the full sample. This change in market behavior at the end of 1997 is critical to the performance of trend following strategies (good to bad) and mean reversion strategies (bad to good).

In summary, investors should be alert to changes in asset market conditions that may disrupt old strategies and enable new ones.
Cautions regarding conclusions include:
- In general, investors cannot reliably determine a change in market conditions until well after the change occurs.
- The constant $0.01 per share trading friction assumed in the trend following and mean reversion examples is unrealistic for much of the sample period. This assumption overstates net returns early in the sample period, most dramatically for the best-performing moving average strategies, such that more realistic frictions may change strategy performance rankings. It is arguable that change in trading frictions over time drives change in market conditions. In other words, precise accounting for trading frictions over time may obviate changes in market conditions and materially improve backtesting.
- The use of index returns in examples ignores the costs of maintaining a liquid fund, thereby overstating performance. As for trading frictions, these costs change over the sample period.
See also Chapter 4: “Accounting for Implementation Frictions” and Chapter 5: “Checking for Market Adaptation” of Avoiding Investment Strategy Flame-outs.