Can investors avoid trend trading whipsaws by using Kalman filters to identify trends? In his February 2016 paper entitled “Trend Without Hiccups – A Kalman Filter Approach”, Eric Benhamou investigates the Kalman filter as a tool to smooth (remove the noise from) asset price series in an adaptive way that avoids most of the response lags of moving averages. He defines the Kalman filter as a recursive operation that forecasts the next value in a series based on incomplete and noisy measurements from an assumed distribution of possibilities. He considers four Kalman filter models:
- Simple model that borrows speed and acceleration concepts from physics with four price inputs to forecast price trajectory.
- Simple models that calculates a series of local linear trends with five price inputs, in a way very similar to Model 1.
- More general version of Models 1 and 2 with 10 price inputs measuring both short-term (a few days) and long-term trend contributions.
- More complex version of Model 3 with 15 price inputs that add effects of oscillations between price extremes over a specified historical interval (14 days).
To test the predictive power of these models, he uses them to identify and trade trends in E-mini S&P 500 futures contract prices. Each trade is only one contract long or short regardless of account value, uses no leverage and includes a $4 round trip commission. Using daily data for E-mini S&P 500 futures from the end of February 2015 through the end of February 2016, he finds that:
- Kalman filter models track price series more closely (react to trend changes more quickly) than moving averages.
- Models 3 and 4 outperform simpler Models 1 and 2 over the sample period (see the table below).
- Model 4, which includes an oscillator term, generates the most total net profit (nearly $40,000, on a daily account margin requirement of only about $5,000 to $6,000) and has the smallest maximum drawdown (-$2,600).
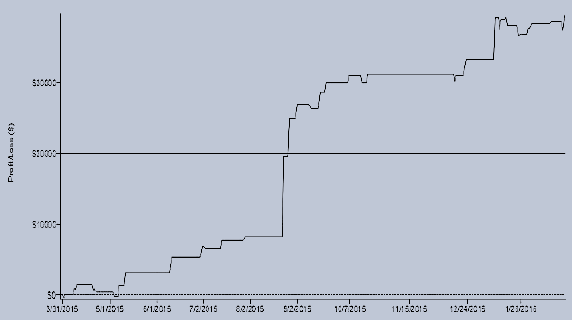
- Model 3 has the highest net annualized Sharpe ratio (1.22). However, the lower Sharpe ratio of Model 4 appears due to upside volatility (see the chart below).
- Models 1 and 2 have relatively large maximum drawdowns that exceed average margin requirements.
- Detailed results for Model 4 suggest that the oscillator term:
- Captures some mean reversion, in addition to trend.
- Interacts only with short term price movement, while trend dominates the long term.
The following table, extracted from the paper, summarizes a few performance statistics for the four Kalman filter models applied to E-mini S&P 500 futures as specified. Model 4 stands out for overall net profit and maximum drawdown. Model 3 stands out for net annualized Sharpe ratio.

The following chart, also from the paper, tracks the cumulative net profit of Kalman filter Model 4 applied to E-mini S&P 500 futures as specified. Results suggest that the Sharpe ratio of Model 4 is lower than the Sharpe ratio of Model 3 due to upside volatility. However, concentration of overall profit in one short trade about the middle of the sample period suggests need for more testing to ensure that this trade is not a rare lucky one.

In summary, evidence indicates that moderately complex Kalman filters may identify exploitable trend and mean reversion patterns in equity index futures.
Cautions regarding findings include:
- The sample is not large in terms of number of trades and, especially, in terms of variety of market conditions.
- Testing multiple models on the same data introduces snooping bias (elevated chance of discovering lucky trades), such that the best-performing model overstates expectations. A small sample elevates this bias. There may be hidden snooping bias in model development (for example, selection of a 14-day oscillator range) via experimentation with unreported alternatives.
- The paper does not compare Kalman filter model performances with those of alternative (and simpler) moving averages.
- Some investors may not be comfortable executing Kalman filter strategies on their own and would bear fees for delegating signal generation to an investment advisor/manager.
- Should robustness tests show persistently strong performance, widespread use of Kalman filters would likely change market behavior due to exhaustion of counterparties.
————————————
On 4/16/16, subscriber Wouter Keller offered the following comments on the study:
“I agree that Kalman filtering is very interesting. But, with 15 parameters, I can make a perfect (polynomial) fit of an annual sample of the monthly (12 points) S&P 500 Index (or any other asset), resulting in 100% data snooping when fitting and testing periods are the same. In fact, I probably only need to cover the bearish subperiods in August 2015 and January 2016 and assume the rest of the sample period to be nearly constant to arrive at big wins, so even an 8-degree polynomial would do the job. Therefore, the results are in my opinion highly misleading.”