What are the best ways to buy or sell tail risk protection (crash insurance)? In his May 2015 paper entitled “Should You Buy or Sell Tail Risk Hedges? A Filtered Bootstrap Approach”, Lorenzo Baldassini uses filtered bootstrap simulations to estimate whether and how an investor can enhance an equity index return distribution (a buy-and-hold benchmark) by buying or selling index put options. He compares benchmark returns to those of the index plus one of the following four put option overlay strategies for investment intervals of one, five or 15 years:
- Static Purchase – iteratively buy put options as crash protection and hold them to expiration.
- Static Sale – iteratively sell put options to collect their premiums and hold them to expiration.
- Dynamic Purchase – iteratively buy put options as crash protection but sell and replace them before expiration if they appreciate above a set percentage threshold.
- Dynamic Sale – iteratively sell put options to collect their premiums but buy them back and replace them if they depreciate below a set percentage threshold.
He considers two values for each of the three overlay parameters used in the simulation model: (1) the budget for option overlay transactions (0.5% or 1.5% of portfolio value); (2) option maturity (3 or 12 months); and, (3) for dynamic overlays, option exit appreciation/depreciation threshold (50% or 500%). For the benchmark and each overlay variation, he runs the simulation 300 times to generate a return distribution. Using daily S&P 500 index returns and daily index put option implied volatilities for different expirations and moneyness during January 2003 through December 2012 to calibrate simulation inputs, he finds that:
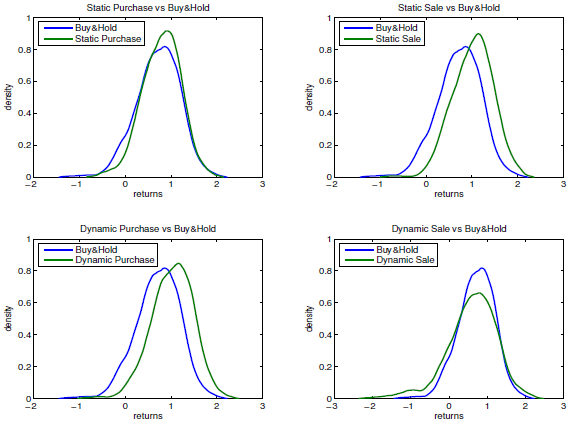
- In general across investment horizons and parameter settings, on a gross basis, the Dynamic Purchase overlay dominates the Static Purchase overlay (for example, see the two charts on the left below).
- In general across investment horizons and parameter settings, on a gross basis, the Static Sale overlay dominates the Dynamic Sale overlay (for example, see the two charts on the right below).
The following four charts, taken from the paper, compare the return distribution of each overlay to that of buy-and-hold for a 15-year investment horizon and the following parameter choices: option overlay budget 0.5%; option maturity 3 months; and, for dynamic overlays, option exit appreciation/depreciation threshold 50%. Results indicate that: (1) Dynamic Purchase is superior to Static Purchase for crash protection; and, (2) Static Sale is superior to Dynamic Sale for tail risk premium harvesting.

In summary, evidence from simulations suggest that investors seeking equity crash protection should closely monitor long put positions, while investors harvesting tail risk premiums should short puts and forget them.
Cautions regarding findings include:
- The actual 2003-2012 data used to generate simulated index and index put option returns may not be representative of long-term stock market behaviors.
- The return generating rules of the simulation model may diverge from reality.
- Analyses are gross, not net. Option trading frictions would reduce returns for the four overlays (shifting their distributions to the left in the above charts). Moreover, since dynamic overlays trade options more often than their static counterparts, net findings may differ from gross findings.
- As noted in the paper, which overlay is best ultimately depends on individual investor risk and reward preferences.
- There may be better ways to implement crash protection than put option overlays.