In December of years 1997-2007, Business Week (BW) invited a group of stock market experts to forecast the levels of major U.S. stock market indexes one year ahead. The participating experts provide forecasts for a given year in December of the preceding year. How well do they do? To check, we compare their average year-end S&P 500 index forecasts for 1997, 1998, 1999, 2000, 2001, 2002, 2003, 2004, 2005, 2006 and 2007 (no longer available) to actual S&P 500 index performance. For reference, we include the 2008 average forecast (based on a much smaller survey). Using the raw forecasts from a total of 199 experts (about 40-80 per year except for 2008, with overlap from year to year), we find that:
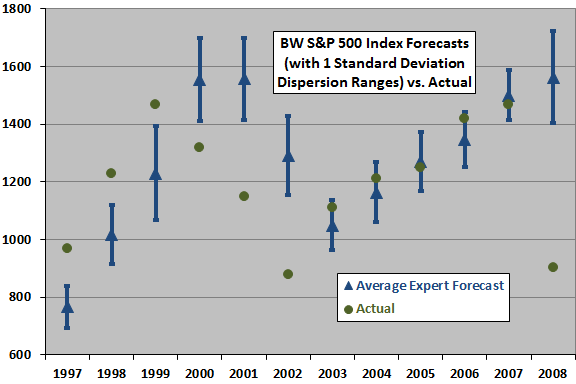
The following chart shows (blue triangles) the average year-end forecasts for all participating experts, with one standard deviation dispersion ranges. About two-thirds of all forecasts for a given year fall within the dispersion range. For comparison, the chart also shows (green circles) the actual values of the S&P 500 index at the end of each year. Actual values are higher than the forecast average six times and lower six times.
The chart shows that groupthink did not work for 1997-2002 and 2008, but was reasonably accurate for 2003-2007. For 1997-1999, the experts failed to predict the pace of Internet Bubble inflation. For 2000-2002, they failed to predict the speed of its deflation. Perhaps 2003-2007 represents a return to a normal level of speculation. However, average forecasting performance for 2008 was the worst ever (since 1997).
Do the results demonstrate any forecasting expertise?

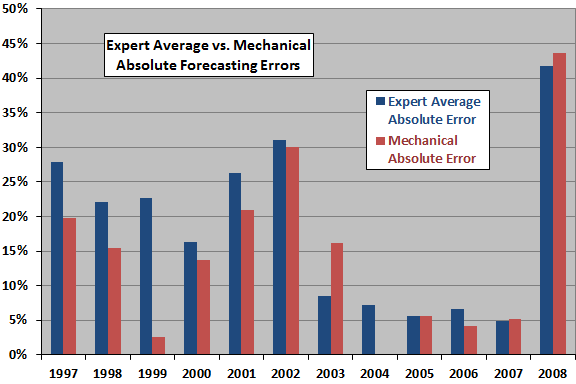
The next chart shows (blue columns) the average absolute percentage error of the forecasts for all participating experts for each year. It shows that annual forecasts calculated by averaging across many experts are off by about 5%-40% (too high or too low) over the past dozen years.
For comparison, the chart also shows (red columns) the absolute error for forecasts calculated mechanically using the average annual S&P 500 index gain from 1951 through the year preceding the forecast year. The mechanical forecasts beat (have a smaller absolute error than) the expert average six times, tie twice and lose three times.
Across all 12 years, the average absolute error for the mechanical approach is 14.8%, compared to 18.4% for the expert average. This result suggests that the typical expert underperforms very simple mechanical forecasting algorithms, perhaps due to innate emotional overreaction/underreaction to recent data. The sample size of 12 years is, however, very small.
Which forecasters have the best and worst records?

The following table ranks the 60 experts who participated in at least three annual forecasts during 2003-2007 based on their average absolute percentage error during that period. We do not include forecast records for 1997-2002 because, as shown by the first chart above, forecasting was apparently much more difficult during those years. We do not include forecast records for 2008 because the number of participating experts is so small (just six). The top (bottom) 10% of forecasters are shaded light green (pink).
In first place, with the lowest average absolute percentage error of 1.5% (based on three forecasts), is Charles Mayer. Bringing up the rear, with average absolute percentage errors over 20% (based on four and five forecasts, respectively) are Barry Ritholtz and Bernie Schaeffer.

In summary, investors should not expect the typical “expert” to outperform a simple extrapolation of the long-term trend in forecasting the level of a broad stock market index one year ahead.
For assessments of the forecasting accuracy of other investing experts, see Guru Grades.