“SACEMS-SACEVS for Value-Momentum Diversification” finds that the “Simple Asset Class ETF Value Strategy” (SACEVS) and the “Simple Asset Class ETF Momentum Strategy” (SACEMS) are mutually diversifying. Do longer samples available from “SACEVS Applied to Mutual Funds” and “SACEMS Applied to Mutual Funds” confirm this finding? To check, we look at the following three equal-weighted (50-50) combinations of the two strategies, rebalanced monthly:
- SACEVS Best Value paired with SACEMS Top 1 (aggressive value and aggressive momentum).
- SACEVS Best Value paired with SACEMS Equally Weighted (EW) Top 3 (aggressive value and diversified momentum).
- SACEVS Weighted paired with SACEMS EW Top 3 (diversified value and diversified momentum).
Using monthly gross returns for SACEVS and SACEMS mutual fund portfolios during September 1997 through July 2019, we find that:
First, we look at SACEVS Best Value-SACEMS Top 1, aggressive value and aggressive momentum. The correlation of monthly returns between these strategies over the available sample period is 0.10, indicating that they substantially diversify each other.
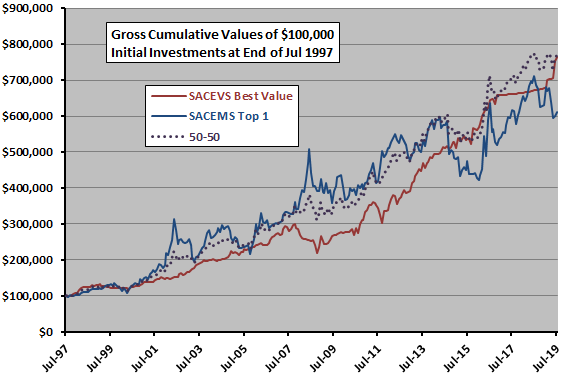
The following chart plots gross cumulative values of $100,000 initial investments in each of SACEVS Best Value, SACEMS Top 1 and 50-50 over the available sample period. Visual inspection suggests that 50-50 is attractively smooth. Quantitatively:
- Average gross monthly returns (standard deviations of monthly returns) for SACEVS Best Value, SACEMS Top 1 and 50-50 are 0.8% (2.7%), 0.9% (5.7%) and 0.8% (3.3%), respectively, translating to rough monthly Sharpe ratios of 0.30, 0.15 and 0.26.
- Compound annual growth rates (CAGR) are 10.8%, 9.8% and 10.9%, respectively.
- Maximum drawdowns (MaxDD) based on monthly data are -27%, -37% and -19%, respectively.
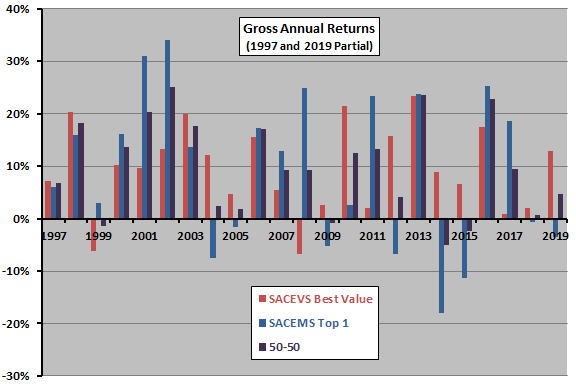
For another perspective, we look at calendar year returns.
The next chart summarizes gross annual returns for SACEVS Best Value, SACEMS Top 1 and 50-50 during 1997 through 2019, with 1997 and 2019 partial. Average annual returns (standard deviations of annual returns) for full years 1998 through 2018 are 9.5% (8.7%), 10.1% (15.0%) and 10.1% (9.4%), respectively. Using average monthly yield on 3-month Treasury bills (T-bill) during a year as the risk-free rate for that year, corresponding gross annual Sharpe ratios are 0.83, 0.56 and 0.87. The 50-50 strategy has negative returns in 2014 and 2015.
Next, we look at SACEVS Best Value-SACEMS EW Top 3, aggressive value and cautious momentum.
The correlation of monthly returns between SACEVS Best Value and SACEMS EW Top 3 over the available sample period is 0.36, indicating that they materially diversify each other.
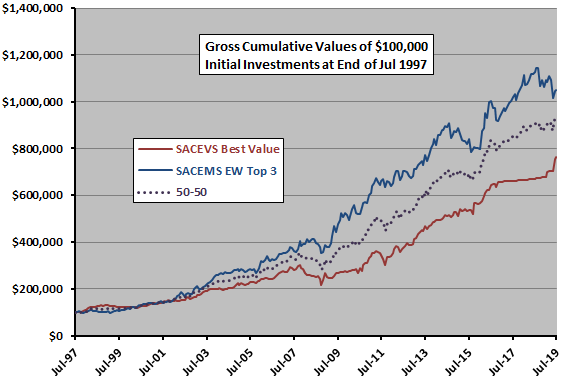
The following chart plots gross cumulative values of $100,000 initial investments in SACEVS Best Value, SACEMS EW Top 3 and 50-50 over the available sample period. Visual inspection suggests that 50-50 is attractively smooth. Quantitatively:
- Average gross monthly returns (standard deviations of monthly returns) for SACEVS Best Value, SACEMS EW Top 3 and 50-50 are 0.8% (2.7%), 1.0% (3.4%) and 0.9% (2.5%), respectively, translating to rough monthly Sharpe ratios of 0.30, 0.28 and 0.35.
- CAGRs are 10.8%, 12.6% and 11.9%, respectively.
- MaxDDs based on monthly data are -27%, -15% and -20%, respectively.
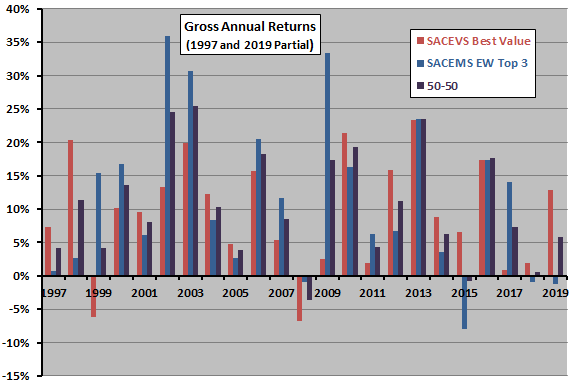
For another perspective, we look at calendar year returns.
The next chart summarizes gross annual returns for each of SACEVS Best Value, SACEMS EW Top 3 and 50-50 over the available sample period, with 1997 and 2019 partial. Average annual returns (standard deviations of annual returns) for full years 1998 through 2018 are 9.5% (8.7%), 12.5% (11.7%) and 11.0% (8.4%), respectively. Using average monthly T-bill yield during a year as the risk-free rate for that year, corresponding gross annual Sharpe ratios are 0.83, 0.88 and 1.04. The 50-50 strategy has negative returns in 2008 and 2015.
Finally, we look at SACEVS Weighted-SACEMS EW Top 3, cautious value and cautious momentum.
The correlation of monthly returns between SACEVS Weighted and SACEMS EW Top 3 over the available sample period is 0.43, indicating that they materially diversify each other.
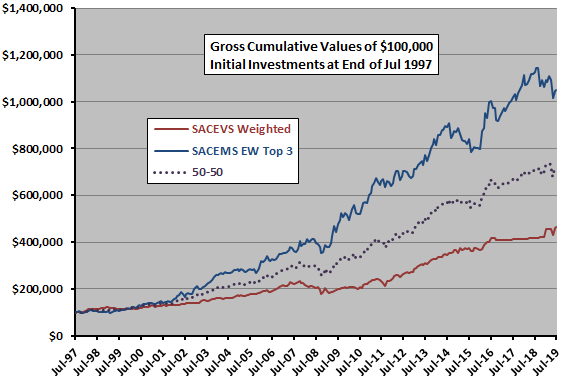
The following chart plots gross cumulative values of $100,000 investments in each of SACEVS Weighted, SACEMS EW Top 3 and 50-50 over the available sample period. Visual inspection suggests that 50-50 is attractively smooth. Quantitatively:
- Average gross monthly returns (standard deviations of monthly returns) for SACEVS Weighted, SACEMS EW Top 3 and 50-50 are 0.6% (2.4%), 1.0% (3.4%) and 0.8% (2.4%), respectively, translating to rough monthly Sharpe ratios 0.26, 0.28 and 0.32.
- CAGRs are 8.0%, 12.6% and 10.5%, respectively.
- MaxDDs based on monthly data are -24%, -15% and -18%, respectively.
For another perspective, we look at calendar year returns.
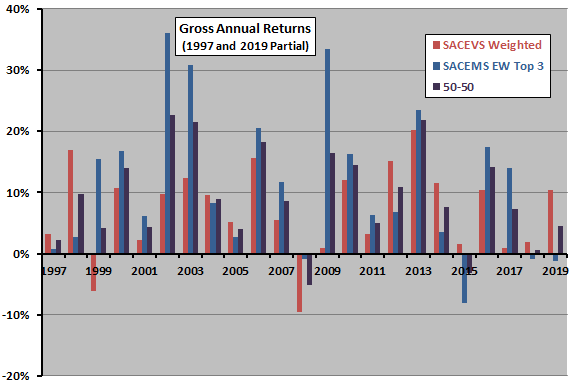
The final chart summarizes gross annual returns for SACEVS Weighted, SACEMS EW Top 3 and 50-50 over the available sample period, with 1997 and 2019 partial. Average annual returns (standard deviations of annual returns) for full years 1998 through 2018 are 7.2% (7.6%), 12.5% (11.7%) and 9.8% (7.8%), respectively. Using average monthly T-bill yield during a year as the risk-free rate for that year, corresponding gross annual Sharpe ratios are 0.67, 0.88 and 0.97. The 50-50 strategy has negative returns in 2008 and 2015.
The following table summarizes key gross annual performance statistics for the SACEVS-SACEMS diversified portfolios over the available full-year sample period. Results suggest the aggressive value and cautious momentum alternative is preferable.

In summary, evidence from the available sample period suggests that SACEMS and SACEVS as applied to mutual funds usefully diversify each other.
Cautions regarding findings include:
- Analyses ignore any costs/constraints (mutual fund loads and penalties for early withdrawals) associated with the base strategies and with rebalancing the 50-50 combination each month. Constraints may be stronger for diversified versions of SACEVS and SACEMS pair than for the aggressive versions.
- Available sample periods are modest for analysis of annual returns.
- Cautions outlined in “SACEVS Applied to Mutual Funds” and “SACEMS Applied to Mutual Funds” also apply.