Do simple stock market valuation ratios work for tactical allocation? In his April 2015 paper entitled “Multiples, Forecasting, and Asset Allocation”, Javier Estrada investigates whether investors can outperform a 60-40 stocks-bonds benchmark portfolio via tactical strategies based on one of three simple stock market valuation ratios: (1) dividend-price ratio (D/P); (2) price-earnings ratio (P/E); or, (3) cyclically adjusted price-earnings ratio (CAPE, or P/E10). The valuation‐based strategies take aggressive (conservative) stances when stocks are cheap (expensive) via combinations of the following rules:
- Designate stocks as cheap (expensive) when a valuation ratio is below (above) its inception-to-date mean by one standard deviation (1SD) or two standard deviations (2SD).
- Use 60-40 stocks-bonds allocations when stocks are not cheap or expensive. When stocks are cheap (expensive), shift toward stocks (bonds) by 20% to 80-20 (40-60) or by 30% to 90-10 (30-70).
- Rebalance either annually or monthly.
For the benchmark portfolio and the valuation-based portfolios when in 60-40 stance, rebalancing occurs only when the stock allocation drifts below 55% or above 65%. To accrue at least 20 years of data for initial valuations, strategy performance measurements span 1920 through 2014 (95 years). Calculations lag dividends and earnings by three months to ensure real-time availability. Testing ignores trading frictions and tax implications. Using monthly S&P 500 Index total returns and the yield on 90-day U.S. Treasury bills (T-bills) during September 1899 through December 2014, he finds that:
- Relationships between valuation ratios and future stock market returns are much stronger for the long term than the short term:
- Based on 106 annual overlapping observations, the correlation between P/D (P/E) and 10‐year future S&P 500 Index annualized return is -0.43 (-0.52).
- Based on 115 observations, the correlation between P/D (P/E) and 1‐year future S&P 500 Index return is -0.18 (-0.10).
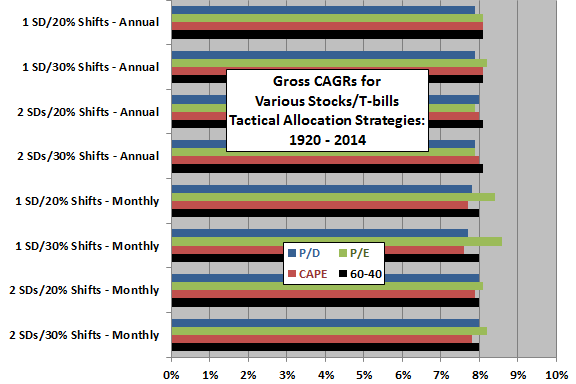
- In general, applying simple valuation metrics tactically does not outperform the 60-40 stocks-bonds benchmark portfolio on a gross basis (see the chart below).
- For annual (monthly) rebalancing, valuation-based strategies rebalance 1.2 to 1.9 (3.3 to 10.7) times more often than the benchmark. Ignoring trading frictions and tax implications is therefore favorable to the valuation-based strategies.
The following chart, constructed from data in the paper, compares gross CAGRs for tactical allocation strategies based on the three stock market valuation ratios and various combinations of rules, and for the 60-40 stocks-bonds benchmark portfolio. In general, the benchmark does as well as or better than the valuation-based strategies. In the few cases where a P/E-based strategy with monthly rebalancing outperforms the benchmark, the former rebalances far more frequently than the latter.

In summary, evidence suggests that U.S. stock market valuation ratios may inform strategic allocation, but they are likely not useful for tactical allocation.
Cautions regarding findings include:
- As noted in the paper, significance based on overlapping 10-year observations (for CAPE and 10-year future returns) can mislead due to series autocorrelations.
- As noted in the paper, performance statistics are gross not net. Accounting for trading frictions would lower performance.
- Use of indexes as test assets tends to overstate performance by ignoring the costs of maintaining a liquid fund for investors.
- Using longer-maturity Treasury instruments rather than T-bills for the “bonds” allocation may produce different findings.
- Strategies consider valuation only of the equities part of the portfolio, not the bonds part of the portfolio.