How much can the (in)accuracy of retirement portfolio modeling assumptions affect conclusions about the safety of retirement income? In their December 2014 paper entitled “How Risky is Your Retirement Income Risk Model?”, Patrick Collins, Huy Lam and Josh Stampfli examine potential weaknesses in the following retirement income modeling approaches:
- Theoretically grounded formulas – often complex with rigid assumptions.
- Historical backtesting – the future will be like the past, requiring long samples.
- Bootstrapping (reshuffled historical returns) – provides alternate histories but does not preserve return time series characteristics (such as serial correlation), and requires long samples.
- Monte Carlo simulation with normal return distributions – sensitive to changes in assumed return statistics and often does not preserve empirical return time series characteristics.
- Monte Carlo simulation with non-normal return distributions – complex and often does not preserve empirical return time series characteristics.
- Vector autoregression – better reflects empirical time series characteristics and can incorporate predictive variables, but requires estimation of regression coefficients and is difficult to implement.
- Regime-switching simulation (multiple interleaved return distributions representing different market states) – complex, requiring estimation of many parameters, and typically involves small samples in terms of number regimes.
They focus on retirement withdrawal sustainability (probability of shortfall) as a risk metric and risks associated with modeling (future asset returns), inflation and longevity assumptions. They employ a series of examples to demonstrate how an overly simple model may distort retirement income risk. Based on analysis and this series of examples, they conclude that:
- Sources of modeling risk are:
- Failing to include all important input variables (for example, expectations for health and inheritance) or exclude irrelevant variables.
- Sensitivity of outcomes to values assumed for input variables.
- How the model treats variability in input variables.
- Assumptions about investor utility and risk aversion.
- In general, models of complex systems (such as markets and economies):
- Are extremely difficult to construct.
- Sometimes present equally credible alternatives that generate significantly different outputs from identical inputs and input values.
- May not produce any clearly winning strategy.
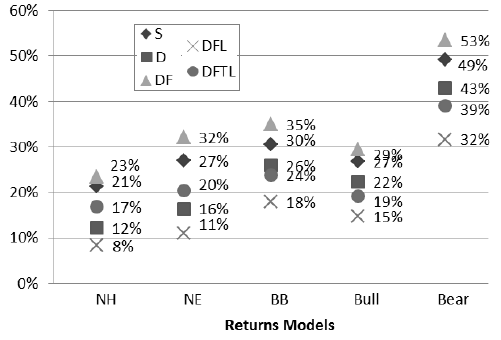
- A progressive series of examples shows that differences in modeling assumptions can produce starkly different outcomes, with probability of shortfall ranging from 8% to 53% (see the chart below).
- Assessment of retirement income sustainability should not rely on results of a single model or on a single risk metric. In many respects, a model is just the model builder’s opinion about how the future may unfold.
The following chart, taken from the paper, compares probabilities of retirement income shortfall (bankruptcy) across 30 Monte Carlo simulations derived from five financial market return scenarios and six levels of financial sophistication. All simulations assess the likelihood that an inflation-adjusted $60,000 annual distribution will exhaust a portfolio valued at $1.25 million at retirement within a specified planning horizon. Simulations assume that inflation varies randomly starting from a trailing 12-month average. The five financial market return scenarios are:
- Normal Historical (NH) – normally distributed asset returns based on static historical means, standard deviations and correlations.
- Normal Efficient (NE) – normally distributed asset returns under the condition that all assets have the same static real Sharpe ratio with normal return distributions.
- Bull/Bear (BB) – dynamic regime switching that incorporates empirical asset return distribution skewness, kurtosis, serial correlation, volatility clustering and correlations, but makes no attempt to predict whether the retirement period commences with a bull market or a bear market.
- Bull – same as BB, but assumes the retirement period commences with a bull market.
- Bear – same as BB, but assumes the retirement period commences with a bear market.
The six levels of financial sophistication are:
- Simple (S) – annually rebalanced, two-asset portfolio lasting 30 years, with no accounting for costs, fees and taxes
- Diversified (D) – extend S by diversifying into 14 asset classes encompassing global equities, currency-hedged global bonds of short and intermediate maturities and a set of U.S. Real Estate Investment Trusts.
- Diversified with Fees (DF) – extend D by including estimated annual costs and fees of 1% on the first million, 0.65% on the second million, 0.35% between two and five million and 0.25% above five million.
- Diversified with Fees and Longevity Statistics (DFL) – modify DF by replacing the 30-year horizon with mortality rate for a 68 year old female in excellent health (average life expectancy about 19 years).
- Diversified with Fees, Taxes and Longevity Statistics (DFTL) – extend DFL by incorporating effects of a constant but fairly complex tax regime that accounts for monthly payment of taxes on different kinds of income, but no tax sheltering.
Results indicate that different combinations of assumptions can drive very different probabilities of retirement portfolio failure, ranging from 8% to 53%. Unsurprisingly, diversification shifts failure rates down, accounting for costs/fees or taxes shifts them up, and accounting for empirical longevity (rather than a nominal 30 years) shifts failure rates down.

In summary, investors should consider multiple retirement income models, market/financial/personal scenarios and multiple risk metrics to mitigate uncertainties in both modeling assumptions and input data.