A subscriber asked about applying the “Simple Asset Class ETF Momentum Strategy” to the funds available to U.S. federal government employees via the Thrift Savings Plan (TSP). To investigate, we test the strategy on the following five funds:
G Fund: Government Securities Investment Fund (G)
F Fund: Fixed Income Index Investment Fund (F)
C Fund: Common Stock Index Investment Fund (C)
S Fund: Small Cap Stock Index Investment Fund (S)
I Fund: International Stock Index Investment Fund (I)
We each month rank these funds based on returns over past (lookback) intervals of one to 12 months. We test Top 1, equally weighted (EW) Top 2 and EW Top 3 portfolios of monthly fund winners. We employ as a benchmark a naively diversified EW portfolio of all five funds, rebalanced monthly (EW All). Using monthly returns for the five funds from initial availability of all five (January 2001) through February 2019, we find that:
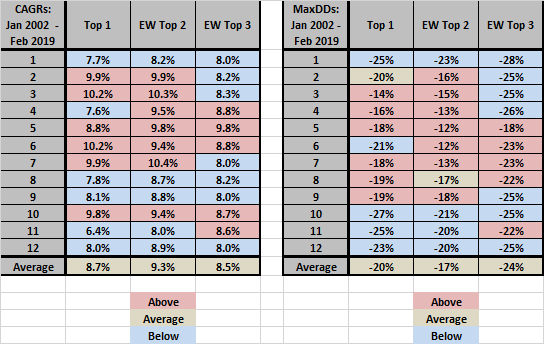
The following tables compare gross compound annual growth rates (CAGR) and maximum drawdowns (MaxDD) of Top 1, EW Top 2 and EW Top 3 portfolios across lookback intervals ranging from one to 12 months (left column of each table), reformed monthly. First monthly returns are for January 2002 to accommodate the 12-month lookback interval. The color key indicates which lookback intervals generate above or below average performance for each portfolio. Notable points are:
- Results are noisy, but with some indication that shorter lookback intervals (two to seven months) are better than longer ones.
- Within a universe of only five assets, reaching for the third-ranked asset may not pay off from a momentum perspective.
We select a 3-month lookback interval for deeper analysis.
What are fund selection frequencies for a 3-month lookback interval?
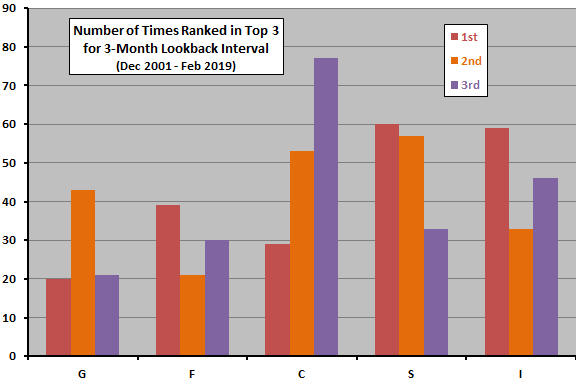
The following chart summarizes selection frequencies for 1st, 2nd and 3rd places among the five assets commencing December 2001. Results suggest that all five funds play material roles in the momentum strategy.
Does momentum effectively pick asset classes that perform well the next month?
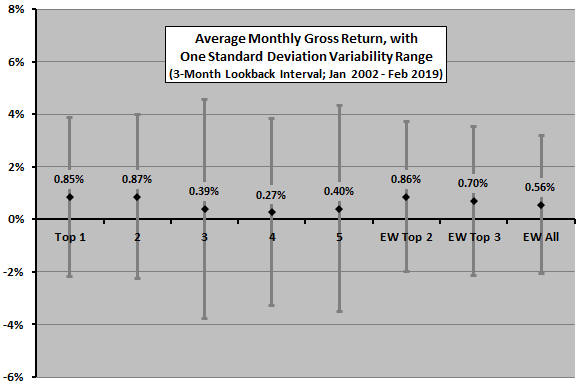
The next chart compares average gross monthly returns with one standard deviation variability ranges over the sample period for momentum ranks 1 through 5 and for EW Top 2, EW Top 3 and EW All portfolios based on a 3-month lookback interval. Notable points are:
- Though the progression is imperfect, results support some belief that asset class proxies with higher (lower) 3-month past returns tend to outperform (underperform) next month.
- Top 1 and EW Top 2 portfolios perform similarly, with EW Top 3 respectable but trailing. All three momentum portfolios beat the EW All benchmark.
Rough gross monthly Sharpe ratios (average return divided by standard deviation of returns) range from 0.08 for rank 4 to 0.28 for ranks 1 and 2.
How do these results translate to momentum portfolio performances?
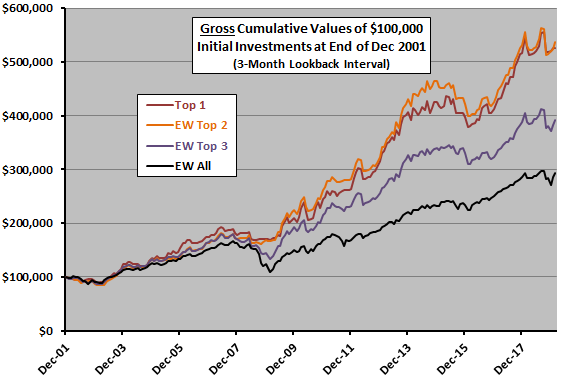
The next chart compares cumulative values of $100,000 initial investments at the end of December 2001 in Top 1, EW Top 2 and EW Top 3 portfolios based on a 3-month lookback interval and in the EW All benchmark. Calculations assume that we:
- Reallocate/rebalance at the close on the last trading day of each month (3-month past fund returns can be estimated accurately just before any trading deadline).
- Trade (switch funds) frictionlessly with no tax implications.
Confirming findings above, Top 1 and EW Top 2 portfolios perform similarly, trailed by EW Top 3 and trailed further by the EW All benchmark.
Is the momentum effect consistent over time?
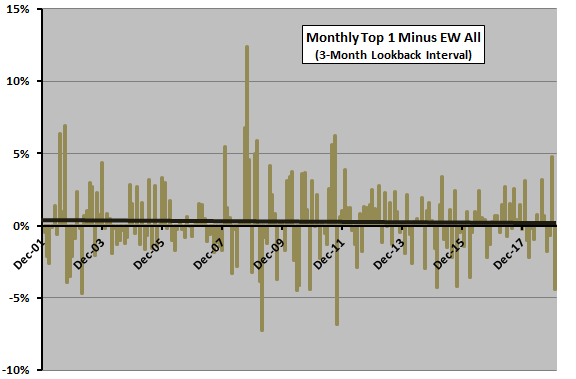
The final chart tracks difference in monthly return between Top 1 and EW All based on a 3-month lookback interval over the sample period, including a best-fit trend line. Results indicate that momentum strategy outperformance weakens over time, but data are highly variable and the sample period is short in terms of number of market cycles.
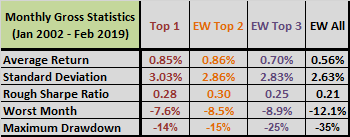
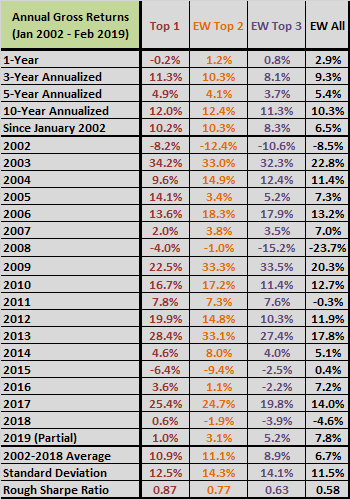
The following tables provide detailed monthly (upper table) and annual (lower table) gross performance statistics for the TSP momentum portfolios and for EW All based on a 3-month lookback interval.
In summary, evidence suggests that a simple momentum strategy applied to Thrift Saving Plan base funds beats an equal-weighted benchmark over the past 17 years, but the added value may be weakening.
Cautions regarding findings include:
- Sample size is moderate (about 72 independent 3-month ranking intervals).
- Selection of the 3-month lookback interval for in-depth analysis impounds data snooping bias (the selection is in-sample). An investor operating in real time may have chosen different lookback intervals at different points.
- As noted, strategy outperformance for a 3-month lookback interval relative to EW All weakens over the sample period.
- The assumption of switches coinciding with monthly momentum measurements may be problematic for this set of funds. Delayed switching may affect performance (see “Effects of Execution Delay on SACEMS”).
- The narrowness of choices available under TSP may make a momentum strategy less resilient to different market conditions than a broader set. For example, the sample period falls mostly within a secular bond bull market. During a bond bear market (rising interest rates), there may be no escape from weakness in equities.