Does compounding rules tend to improve the performance of stock-picking strategies? In the October 2014 draft of their paper entitled “Does Complexity Imply Value, AAII Value Strategies from 1963 to 2013”, Wesley Gray, Jack Vogel and Yang Xu compare 13 stock strategies labeled as “Value” by the American Association for Individual Investors (AAII) to each other and to a simple “low-price” value strategy. The simple strategy each year selects the tenth of stocks with the highest Earnings Before Interest, Taxes, Depreciation and Amortization-to-Total Enterprise Value ratios (EBITDA/TEV), excluding financial firms. To ensure liquidity, they focus on stocks with market capitalizations above the NYSE 40th percentile. To ensure real-time availability of inputs, they lag firm accounting data. To assess performance consistency, they consider three subperiods: July 1963 through December 1980; January 1981 through December 1996; and, January 1997 through December 2013. Because portfolios are equally weighted, they include the S&P 500 equal-weight total return index (S&P 500 EW) as a benchmark. Using stock price and firm accounting data for a broad sample of U.S. common stocks during July 1963 through December 2013, they find that:
- The average number of stocks in competing portfolios varies widely, from as low as two for the “Cash Rich Firms” strategy to as many as 96 for EBITDA/TEV.
- Competing strategies mostly pick similar stocks. The average monthly return correlation between EBITDA/TEV (S&P 500 EW) and the 13 AAII portfolios is 0.80 (0.81). The correlation of monthly returns between EBITDA/TEV and S&P 500 EW is 0.95.
- Pitroski’s FSCORE is generally the best performer, but EBITDA/TEV is competitive with it. Specifically (see the table and chart below):
- The annually rebalanced, equally weighted FSCORE portfolio generates a gross compound annual growth rate (CAGR) of 16.7%, a gross annualized Sharpe ratio of 0.70 and a gross monthly four-factor (market, size, book-to-market, momentum) alpha of 0.33%.
- The annually rebalanced, equally weighted EBITDA/TEVportfolio generates a gross CAGR of 16.5%, a gross annualized Sharpe ratio of 0.65 and a gross monthly four-factor alpha of 0.37%.
- FSCORE and EBITDA/TEV perform well compared to S&P 500 EW and to other value strategies in all three subperiods.
The following table, constructed from data in the paper, summarizes rankings (out of 14) of the FSCORE and EBITDA/TEV strategies across six gross performance metrics: four-factor alpha; CAGR; annualized standard deviation of monthly returns (Volatility); annualized Sharpe ratio; annualized standard deviation of negative monthly returns (Downside Deviation); and annualized Sortino ratio. Rankings for Volatility and Downside Deviation are low to high. Rankings for other metrics are high to low. Results indicate that the simply constructed EBITDA/TEV is competitive with the much more complex FSCORE.

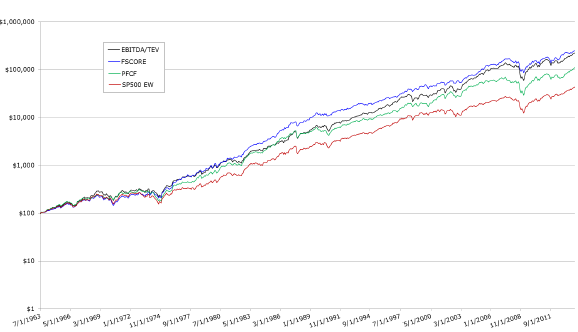
The following chart, taken from the paper, compares the gross cumulative values of $100 initial investments over the entire sample period in four strategies: (1) EBITDA/TEV; (2) FSCORE; (3) Price to Free Cash Flow (PFCF); and, the S&P 500 EW benchmark. Overall, FSCORE outperforms the other three strategies. EBITDA/TEV outperforms after 1992, while FSCORE outperforms between 1973 and 1992. EBITDA/TEV outperforms in four of six bull markets. In bear markets, there is no clear winner. FSCORE has the lowest maximum drawdown (but still large at around 50%).

In summary, evidence suggests that simple value investing strategies can be competitive with the best complex value investing models.
A possible interpretation is that compounding rules in a stock-picking strategy is at least as likely to amplify data snooping as it is to isolate better stocks.
Cautions regarding findings include:
- As noted in the paper, analysis is limited to fairly large stocks, and the conclusions may not apply to micro-caps or small-caps.
- Reported returns are gross, not net. Accounting for portfolio reformation/rebalancing frictions would reduce returns. Annual rebalancing mitigates effects of trading frictions. However;
- Different strategies may generate different portfolio turnovers, such that net strategy rankings differ from gross strategy rankings.
- From an individual investor point of view, the number of stocks in the portfolio is also germane to frictions (minimum or fixed elements). Most individuals cannot practically divide their capital among many positions.
- Testing of many strategies on the same set of data introduces data snooping bias, such that the performance of the best strategies tend to overstate expectations.