How much performance improvement comes from rebalancing a stocks-bonds portfolio, and what specific rebalancing approach works best? In their August 2014 paper entitled “Testing Rebalancing Strategies for Stock-Bond Portfolios Across Different Asset Allocations”, Hubert Dichtl, Wolfgang Drobetz and Martin Wambach investigate the net performance implications of different rebalancing approaches and different rebalancing frequencies on portfolios of stocks and government bonds with different weights and in different markets. With buy-and-hold as a benchmark, they consider three types of rebalancing rules: (1) strict periodic rebalancing to target weights; (2) threshold rebalancing, meaning periodic rebalancing to target weights if out-of-balance by 3% or more; and, (3) range rebalancing, meaning periodic rebalancing to plus (minus) 3% of target weights if above (below) target weights by more than 3%. They consider annual, quarterly and monthly rebalancing frequencies. They use 30 years of broad U.S., UK and German stock market, bond market and risk-free returns to construct simulations with 10-year investment horizons. Their simulation approach preserves most of the asset class time series characteristics, including stocks-bonds correlations. They assume round-trip rebalancing frictions of 0.15% (0.10% for stocks and 0.05% for bonds). Using monthly returns for country stock and bonds markets and risk-free yields during January 1982 through December 2011 to generate 100,000 simulated 10-year return paths, they find that:
- Using net Sharpe ratio to assess rebalancing of U.S. stock and bond allocations across all rebalancing rules and frequencies:
- The highest net Sharpe ratios for both buy-and-hold and rebalancing come from stock allocations in the range 20% to 40%.
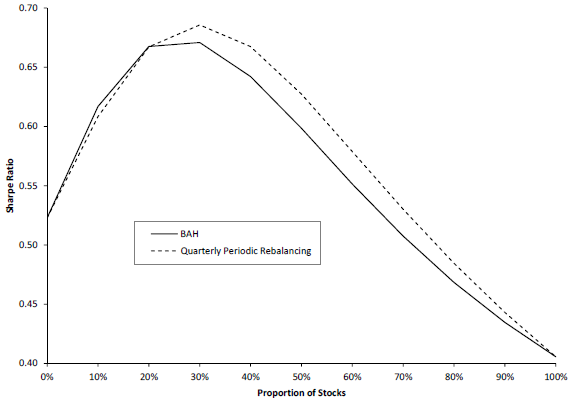
- Rebalancing generally beats buy-and-hold for stock allocations in the range 20% to 90% (for example, see the chart below).
- Rebalancing outperforms buy-and-hold by the widest percentage margin (but only 5% higher Sharpe ratio) for stock allocations in the range 50% to 60%.
- Effectiveness of rebalancing is largely insensitive both to specific rebalancing rule (periodic, threshold or range) and rebalancing frequency (annual, quarterly or monthly).
- Results are generally similar using Sortino ratio or Omega ratio rather than Sharpe ratio.
- Results are similar for UK and German markets.
- Optimal asset allocations vary across countries and subperiods.
The following chart, taken from the paper, compares net Sharpe ratios of buy-and-hold and the simulation average for quarterly periodic rebalancing across different initial/target stocks-bonds allocations for 10-year investment horizons in the U.S. Quarterly periodic rebalancing on average beats buy-and-hold for stocks allocations of least 30%. Other rebalancing rules and rebalancing frequencies produce similar results.

In summary, evidence from simulations based on three decades of data indicates that regular rebalancing of a stocks-bonds portfolio over a 10-year period beats buying and holding an initial allocation when stocks comprise 30% to 90% of the portfolio.
Cautions regarding findings include:
- The specified trading frictions are arguably “modern” and too low for the early part the sample period, to the advantage of rebalancing.
- A secular bull market in bonds (declining interest rates) dominates the sample used to generate simulations, potentially overestimating optimal bond allocations.
- Simulation may still suppress features of the actual time series and may not account for investor feedback generated by an actual time series.